HVIEW2D - coloured isosurface representation
From BAWiki
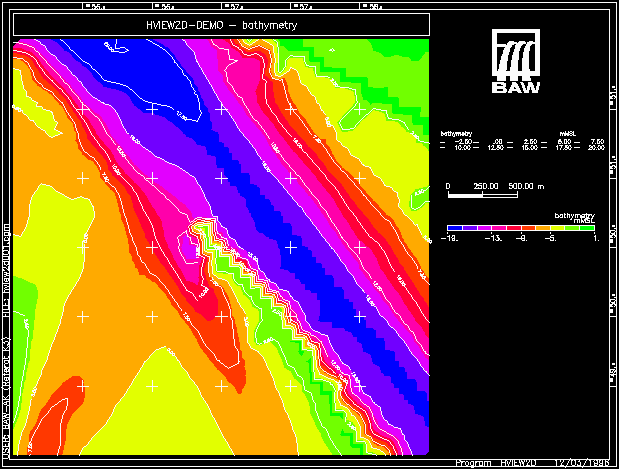
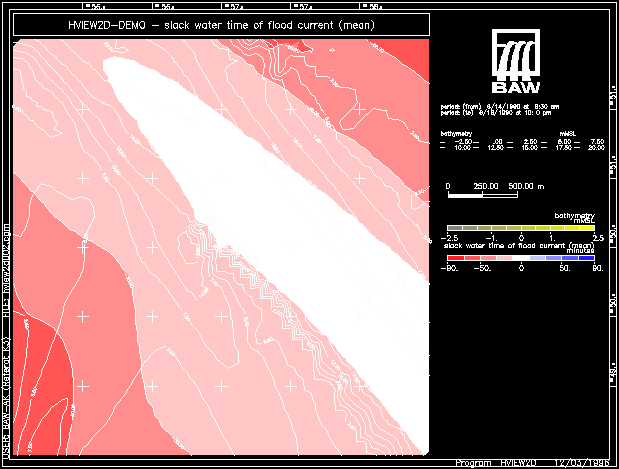
In a coloured isosurface representation all data values defined at the nodal points of a scene are converted into a distinct colour in dependence of a colour scale. Normally the mean value at the nodes of a single polygon is used as the representative one for the whole polygon. Therefore the whole polygon is filled using a constant colour. If a vector quantity is displayed the colour for shading is representative for the value of the vector and an additional normalized lenght vector arrow is superimposed which characterises the orientation of the vector.
The following demo examples are currently available for this type of graphical data representation:
bathymetry
slack water time of flood current
tide volume
maximum ebb current velocity
back to HVIEW2D


