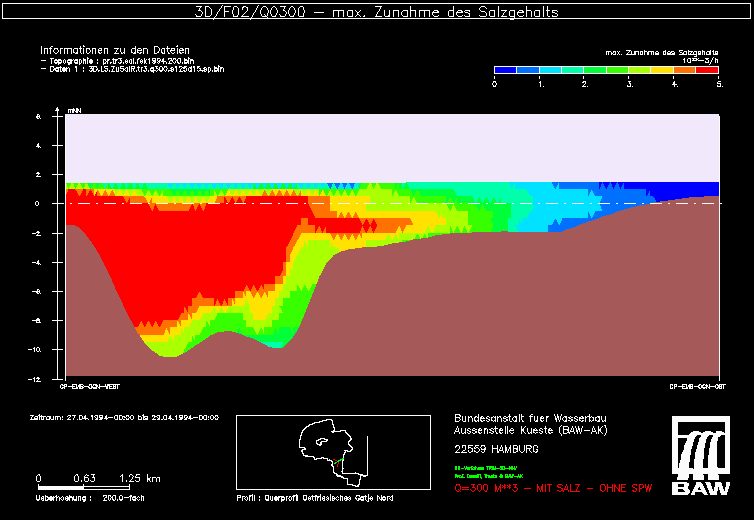
Example: Maximum Increase of Salinity in the Ems Estuary
From BAWiki
The figure above shows maximum increase of salinity for a vertical section along the cross profile Ostfriesisches Gatje Nord (in the area of the Außenems). The vertical is superelevated by a factor of 200. The period of data analysis is two days.
Extreme values for increase of salinity (more than 5 PSU per hour) have been calculated for the deep channel in the left part of the figure. Increase of salinity in one place is influenced by several processes: horizontal and vertical advection of salinity as well as vertical and horizontal turbulent mixing. Actual rates of change are mainly caused by local horizontal gradients of salinity in combination with strong current velocities.
The spatial variation for the maximum increase of salinity differs significantly from the variations found for the maximum decrease of salinity. This is mainly due to different ebb- and flood flow-profiles (in horizontal as well as vertical direction) as well as to the path taken by the outflow of less saline fresh water from the estuary.

back to Characteristic Numbers of Salinity (independent of tides)
