LQ2PRO: Plan View Visualization: Difference between revisions
From BAWiki
imported>Mueller-hagedorn |
The LinkTitles extension automatically added links to existing pages (<a target="_blank" rel="nofollow noreferrer noopener" class="external free" href="https://github.com/bovender/LinkTitles">https://github.com/bovender/LinkTitles</a>). |
||
| (3 intermediate revisions by 2 users not shown) | |||
| Line 1: | Line 1: | ||
[[de:LQ2PRO | [[de:LQ2PRO: Draufsicht-Darstellung]] | ||
[[File:d2.png|frame|LQ2PRO - plan view visualization]] | [[File:d2.png|frame|LQ2PRO - plan view visualization]] | ||
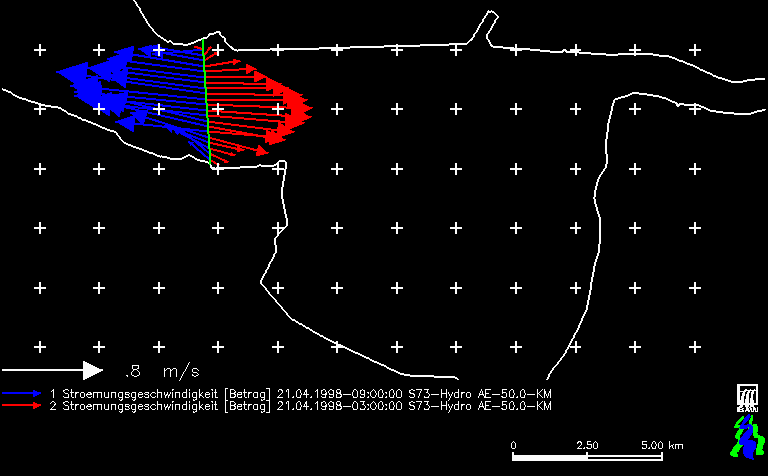
'''sample of a downview (D) graphical output, generated by program LQ2PRO''' | '''sample of a downview (D) graphical output, generated by program [[LQ2PRO]]''' | ||
* '''Area Shown''': Outer Ems and Dollart | * '''Area Shown''': Outer Ems and Dollart | ||
* '''Location of profile''': Cross sectional profile at Ems kilometer 50 | * '''Location of profile''': Cross sectional profile at Ems kilometer 50 | ||
* '''diagram''': absolute values and direction of currents at the same times as shown in the sample of an [[side view visualization]] | * '''diagram''': absolute values and direction of currents at the same times as shown in the sample of an [[side view visualization]] | ||
---- | |||
back to [[LQ2PRO]] | |||
Latest revision as of 09:18, 21 October 2022

sample of a downview (D) graphical output, generated by program LQ2PRO
- Area Shown: Outer Ems and Dollart
- Location of profile: Cross sectional profile at Ems kilometer 50
- diagram: absolute values and direction of currents at the same times as shown in the sample of an side view visualization
back to LQ2PRO
