
Nicht kategorisierte Dateien
Unten werden bis zu 50 Ergebnisse im Bereich 4.701 bis 4.750 angezeigt.
-
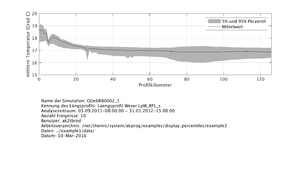 300px-Mittlere Temperatur.png 300 × 180; 11 KB
-
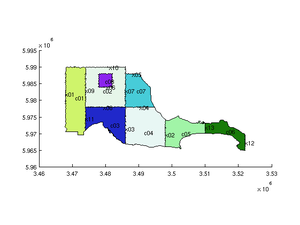 300px-Ncaggregate patch.png 300 × 225; 24 KB
-
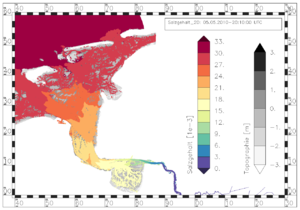
 300px-Ncaggregate water level.png 300 × 300; 46 KB
-
 300px-NcplotBspFaceArea.png 300 × 210; 43 KB
-
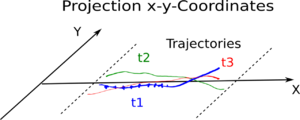 300px-NetCDF Projection XY Coordinates Traj.png 300 × 120; 11 KB
-
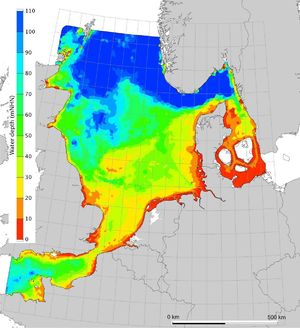 300px-Northsea modeltopography web.jpg 300 × 328; 21 KB
-
 300px-Numerikdachf15.jpg 300 × 182; 6 KB
-
 300px-Numerikdachf2.jpg 300 × 182; 6 KB
-
 300px-Numerikdreieckf15.jpg 300 × 182; 6 KB
-
 300px-Numerikdreieckf2.jpg 300 × 182; 6 KB
-
 300px-NumerikUeberfallhoehe.png 300 × 213; 12 KB
-
 300px-Parallel.png 300 × 212; 10 KB
-
 300px-Physikal-Modell-Lauffen.png 300 × 200; 133 KB
-
 300px-Poleni.jpg 300 × 72; 4 KB
-
 300px-Qp ems salinity.png 300 × 225; 34 KB
-
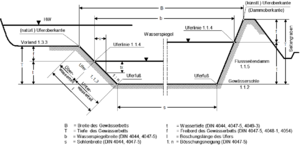 300px-Querschnitt eines Gewässerbetts.png 300 × 145; 22 KB
-
 300px-Rückstaueinfluss schmalkronig.png 300 × 255; 42 KB
-
 300px-Schief.png 300 × 212; 12 KB
-
 300px-Schmalkronig.png 300 × 300; 112 KB
-
 300px-Sigma dachförmig1 neu1.png 300 × 256; 29 KB
-
 300px-Sigma dachförmig2 neu.png 300 × 255; 24 KB
-
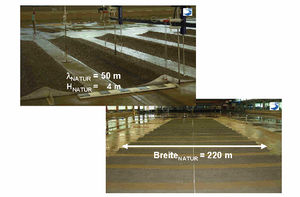
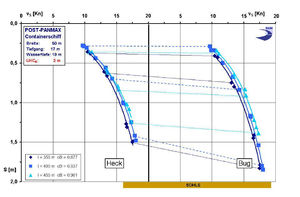 300px-Squat laenge b1.jpg 300 × 197; 13 KB
-
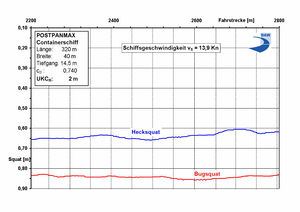
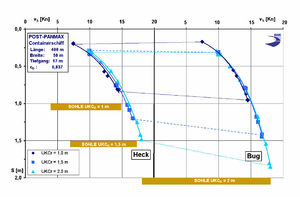 300px-Squat laenge b2.jpg 300 × 197; 13 KB
-
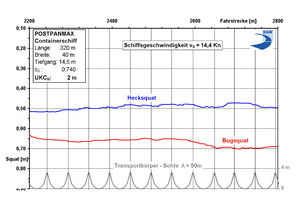
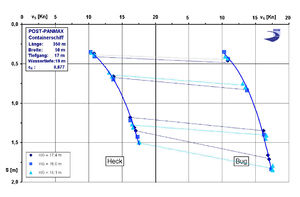 300px-Squat laenge b3.jpg 300 × 197; 12 KB
-
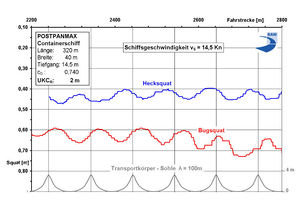
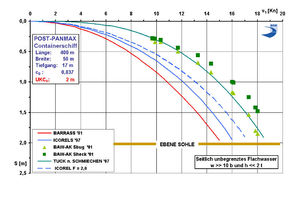 300px-Squat laenge b4.jpg 300 × 197; 16 KB
-
 300px-Squat TKsohle b1.jpg 300 × 197; 13 KB
-
 300px-Squat TKsohle b2a.jpg 300 × 212; 13 KB
-
 300px-Squat TKsohle b2b.jpg 300 × 212; 13 KB
-
 300px-Squat TKsohle b2c.jpg 300 × 212; 15 KB
-
 300px-Squat TKsohle b2ges.png 300 × 187; 26 KB
-
 300px-Squat TKsohle b3.png 300 × 187; 24 KB
-
 300px-Squat TKsohle b4.png 300 × 187; 22 KB
-
 300px-Squat TKsohle b5.jpg 300 × 212; 16 KB
-
 300px-Streichwehr Fulda.jpg 300 × 225; 16 KB
-
 300px-StreichwehrHameln1.jpg 300 × 225; 14 KB
-
 300px-StreichwehrHameln2.jpg 300 × 225; 14 KB
-
 300px-StreichwehrMurg1.jpg 300 × 225; 19 KB
-
 300px-StreichwehrMurg2.jpg 300 × 225; 16 KB
-
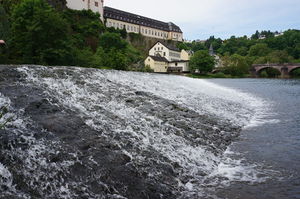 300px-Streichwehr Weilburg.jpg 300 × 199; 19 KB
-
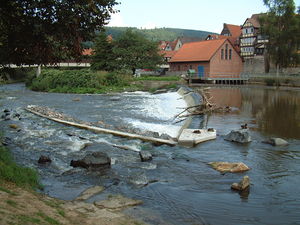 300px-Streichwehr Werra.jpg 300 × 225; 19 KB
-
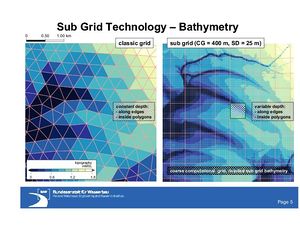 300px-Sub grid bathymetry g lang.jpeg 300 × 232; 17 KB
-
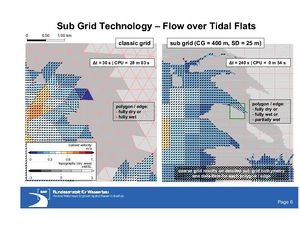 300px-Sub grid flow g lang.jpeg 300 × 232; 18 KB
-
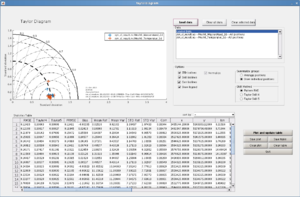 300px-Taylordiagrammgui.png 300 × 197; 49 KB
-
 300px-Tidal current ellipse definition.gif 300 × 410; 10 KB
-
 300px-Tidedynamik Weser2009.png 300 × 156; 45 KB
-
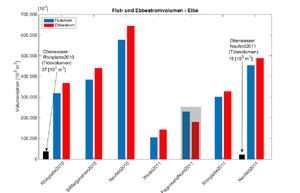 300px-Tidekennwerte Volumenstrom Q FlutEbbe Elbe2010-2011.png 300 × 193; 21 KB
-
 300px-Tides animation.png 300 × 183; 93 KB
-
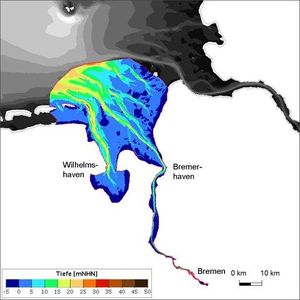 300px-Topo jadeweser small.jpg 300 × 300; 16 KB
-
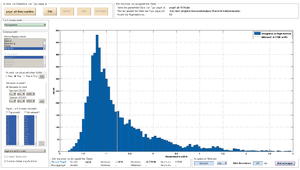 300px-TTpegel histogramm.png 300 × 170; 29 KB
-
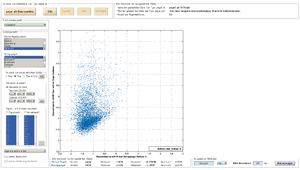 300px-TTpegel korrelation.png 300 × 170; 35 KB


