
Nicht kategorisierte Dateien
Unten werden bis zu 50 Ergebnisse im Bereich 1.501 bis 1.550 angezeigt.
-
 120px-Methoden naturmessung 3.jpg 120 × 85; 4 KB
-
 120px-Methoden naturmessung 4.jpg 120 × 85; 4 KB
-
 120px-Methoden naturmessung 5.jpg 120 × 85; 4 KB
-
 120px-Methoden Schiffsfuehrungssimulation Bild2a.jpg 120 × 90; 4 KB
-
 120px-Methoden Schiffsführungssimulation Bild3.jpg 120 × 90; 3 KB
-
 120px-Methoden Schiffsführungssimulation.jpg 120 × 85; 3 KB
-
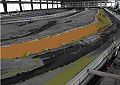
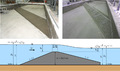
 120px-Methoden wasserbauliches Versuchswesen 1.jpg 120 × 85; 4 KB
-
 120px-Methoden wasserbauliches Versuchswesen 2a.jpg 120 × 85; 5 KB
-
 120px-Methoden wasserbauliches Versuchswesen 2b.jpg 120 × 85; 4 KB
-
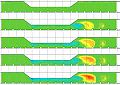
 120px-Methoden wasserbauliches Versuchswesen 3.jpg 120 × 85; 4 KB
-
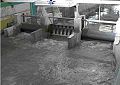
 120px-Methoden wasserbauliches Versuchswesen 4.jpg 120 × 85; 4 KB
-
 120px-Mittlere Temperatur.png 120 × 72; 3 KB
-
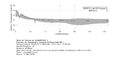
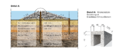
 120px-Modell dachförmig.png 120 × 71; 17 KB
-
 120px-NBAHannover.png 120 × 50; 9 KB
-
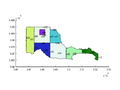 120px-Ncaggregate patch.png 120 × 90; 7 KB
-
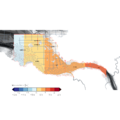 120px-Ncaggregate water level.png 120 × 120; 10 KB
-
 120px-NcplotBspBestPals.png 120 × 84; 10 KB
-
 120px-NcplotBspBoundsGap.png 120 × 84; 12 KB
-
 120px-NcplotBspBoundsLinear.png 120 × 84; 13 KB
-
 120px-NcplotBspBoundsLogNat.png 120 × 84; 12 KB
-
 120px-NcplotBspBoundsNonLinear.png 120 × 84; 12 KB
-
 120px-NcplotBspDataDesc.png 120 × 84; 10 KB
-
 120px-NcplotBspEdgeLine.png 120 × 84; 10 KB
-
 120px-NcplotBspEdgePoint.png 120 × 84; 12 KB
-
 120px-NcplotBspFaceArea.png 120 × 84; 13 KB
-
 120px-NcplotBspFacePoint.png 120 × 84; 10 KB
-
 120px-NcplotBspFrameBSH.png 120 × 84; 15 KB
-
 120px-NcplotBspFrameBWK.png 120 × 84; 13 KB
-
 120px-NcplotBspFrameGrid.png 120 × 84; 15 KB
-
 120px-NcplotBspFrameRechteck.png 120 × 84; 12 KB
-
 120px-NcplotBspFrameSchachlinie.png 120 × 84; 14 KB
-
 120px-NcplotBspFrameStandard.png 120 × 84; 13 KB
-
 120px-NcplotBspGrid 0.png 120 × 84; 15 KB
-
 120px-NcplotBspGrid 1.png 120 × 84; 18 KB
-
 120px-NcplotBspHlimit 0.000m.png 120 × 84; 13 KB
-
 120px-NcplotBspHlimit 0.010m.png 120 × 84; 12 KB
-
 120px-NcplotBspHlimit 0.025m.png 120 × 84; 12 KB
-
 120px-NcplotBspHlimit 0.100m.png 120 × 84; 12 KB
-
 120px-NcplotBspHlimit 0.250m.png 120 × 84; 12 KB
-
 120px-NcplotBspNodeMarker.png 120 × 84; 10 KB
-
 120px-NcplotBspNodeText.png 120 × 84; 10 KB
-
 120px-NcplotBspSubgridTopo.png 120 × 84; 12 KB
-
 120px-NcplotBspSubgridWstd.png 120 × 84; 11 KB
-
 120px-NcplotBspTextData.png 120 × 84; 10 KB
-
 120px-NcplotBspTwo Maps.png 120 × 84; 9 KB
-
 120px-NcplotBspVecArdCP.png 120 × 84; 22 KB
-
 120px-NcplotBspVecArdPC.png 120 × 84; 22 KB
-
 120px-NcplotBspVecArdPP.png 120 × 84; 19 KB
-
 120px-NcplotBspVecLineCC.png 120 × 84; 21 KB
-
 120px-NcplotBspVecLinePP.png 120 × 84; 18 KB


