Actions

NCPLOT: Example figures

From BAWiki

Revision as of 13:54, 22 March 2013 by imported>Spohr Susanne (Created page with 'de:Beispiel-Grafiken: NCPLOT The sample pictures should give an impression of the capability of the program NCPLOT. =Examples= ===Visualisation of "node" data=== {| bor…')
(diff) ← Older revision | Latest revision (diff) | Newer revision → (diff)

The sample pictures should give an impression of the capability of the program NCPLOT.

Examples

Visualisation of "node" data

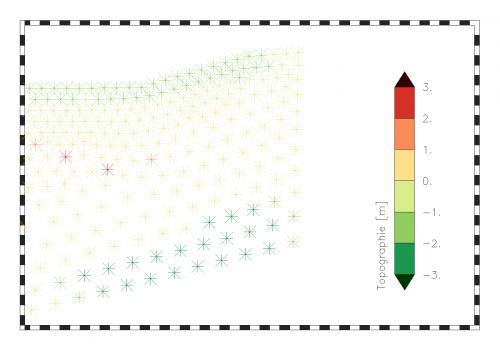
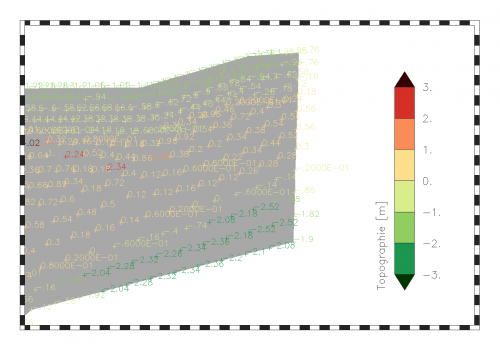
Node data visualized by marker symbols Node data with text symbolization
Node data visualized by marker symbols
Node data with markers plus text with data value


Visualisation of "edge" data

Edge data visualized by marker symbols Edge data with line symbolization
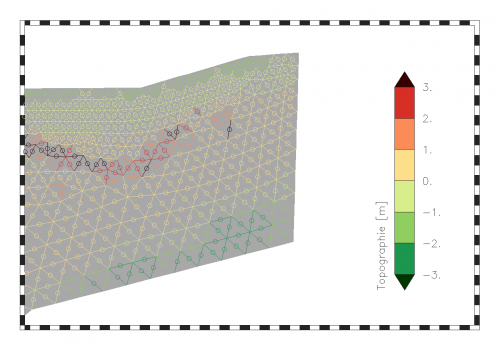
Edge data visualized by markers at the middle of the edge
Edge data visualized by markers at the middle of the edge and line symbolization


Visualisation of "face" data

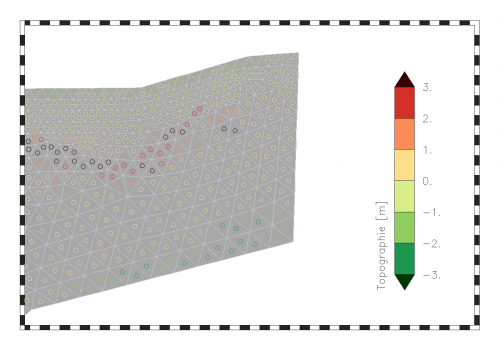
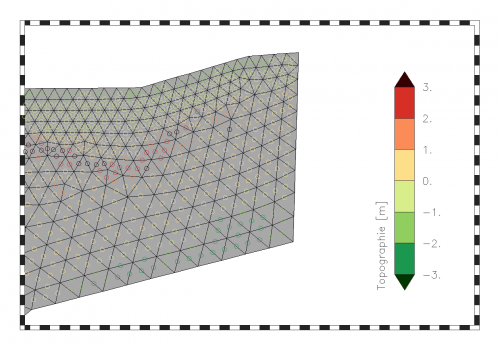
Face data visualized by marker symbols Face data with fill area symbolization
Face data visualized by markers at the polygon center
Face data visualized by fill area symbolization


Show the calculation grid

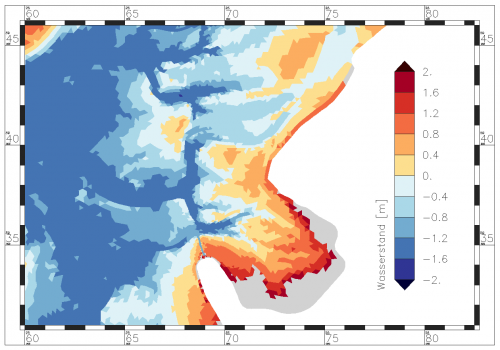
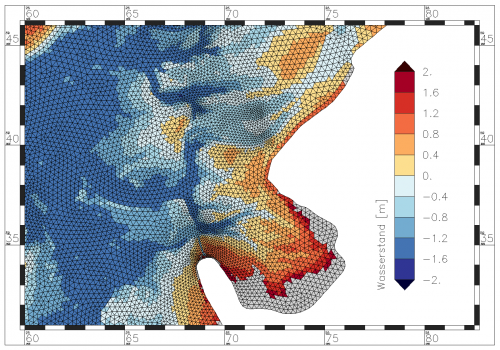
Water level without grid Water level with overlaid grid
Synoptic water level without grid
Water level with overlaid calculation grid


Data with subgrid information

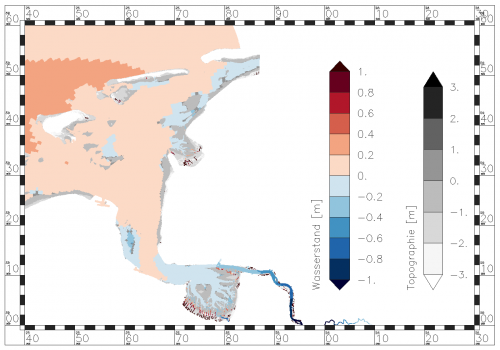
Topography with details on a subgrid Water level on subgrid topography
Topography with details on a subgrid
Water level underlaid with subgrid topography


Multiple maps in one picture

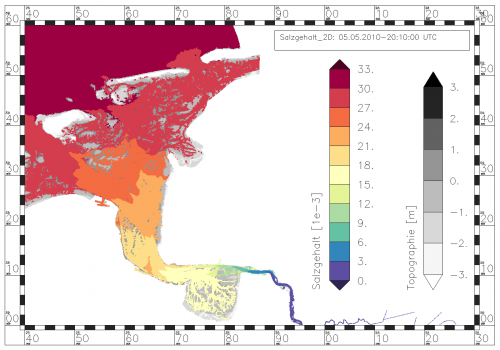
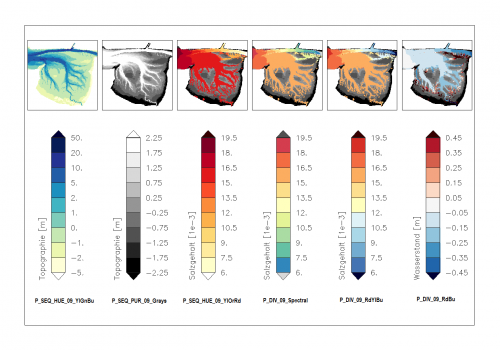
Comparison of water level and salinity Collection of suitable color ramps
Comparison of water level and salinity
Collection of particularly suitable color ramps


back to NCPLOT