LQ2PRO: Side View Visualization
From BAWiki

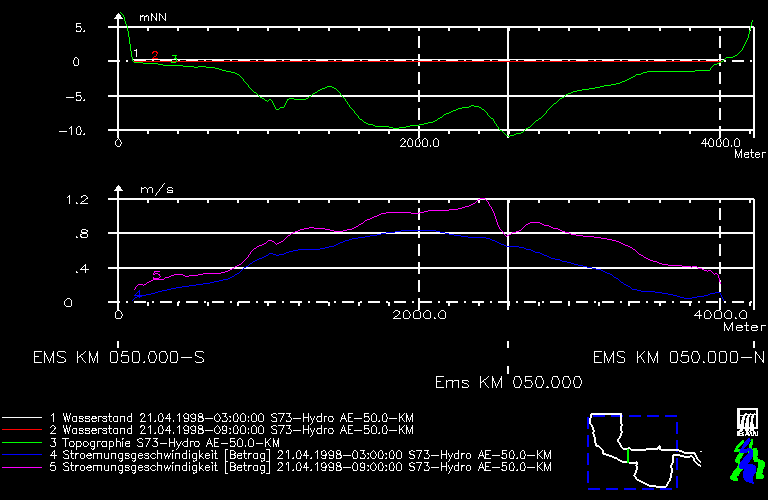
sample of a longitudinal/corss-sectional (LQ) graphical output, generated by program LQ2PRO
- Area Shown: Outer Ems and Dollart
- Location of profile: Cross sectional profile at Ems kilometer 50
- 1st diagram: water level at two different times (lood and ebb phase) and bathymetry.
- 2nd diagram: absolute values of current at exactly the same times.
