Example:Period of Data Analysis
From BAWiki
Tide independent characteristic numbers of water level have been calculated from the numerically calculated results for a synthetic storm surge scenario in the Ems Estuary. The following boundary conditions were applied:
- the peak storm surge water level at Emden lies 6,19 m above mean sea level;
- the fresh water inflow from the Unterems corresponds to the long-term mean value of 38 m**3/s;
- the transient atmospheric wind field is assumed to coincide with the one during the storm surge on January 28th, 1994. The wind speed was increased by a factor of 30% compared to the real velocities.
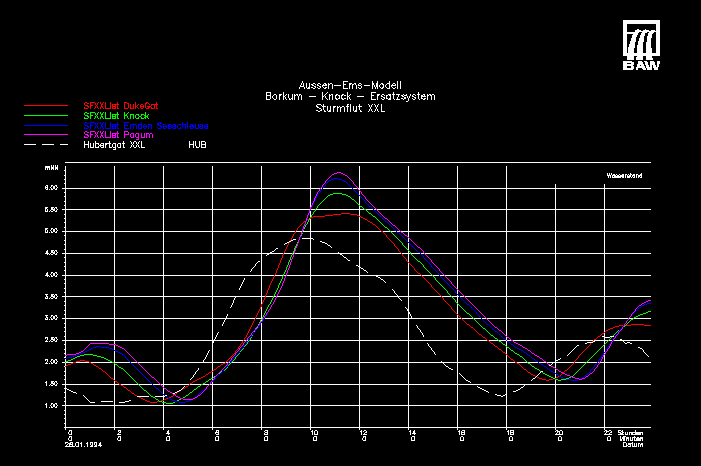
The figure shows time-series (24 h duration) of water level elevation for tidal gauges at Hubergat, Dukegat, Knock, Emden Seeschleuse and Pogum.
The computer program LZKWF was applied to perform an automatic analysis using the data from the numerical model to calculate tide independant characteristic numbers of water level elevation. The period of data analysis is equivalent with the period shown in the figure above. Results of analyses are displayed in several example figures enclosed

