NCPLOT
From BAWiki
Basic Information
Name of Program
NCPLOT
Version-Date
January 2020
Description-Date
January 2020
Catchwords
graphical postprocessor
graphical presentation of CF NetCDF data (unknown attributes are ignored)
finite element models
finite difference models
orthogonal unstructured grid model
orthogonal unstructured grid model with subgrid information
conversion or transformation (extensive - intensive) of physical units
calculation of new quantities (for display) from one or several input data sets
(optional) filter based on water depth
(optional) filter based on number of observations
Acknowledgment: This project took advantage of netCDF software developed by UCAR/Unidata (www.unidata.ucar.edu/software/netcdf/).
Short Description of Functionality
The graphical postprocessor NCPLOT can be used for a graphical presentation
of simulation and analysis results, which is stored in CF NetCDF data format.
The data can be defined on nodes, edges or faces. The program works on 2D-data,
3D-data and on data with details scaled on a subgrid.

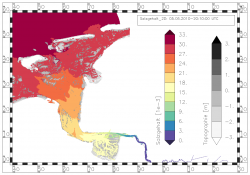
The sample pictures illustrate the capability of the program NCPLOT.
Example figures: NCPLOT
Basically, NCPLOT distinguishes linear from areal chart types.
For area charts the symbolization of the data is depending on the data value
(color legend, proportional arrow).
For linear charts, the values of data series are plotted on an axis.
The symbolization of the data series is independent of the data value.
- Map, or top view illustration
- time series
- profile view
- depth profile
NCPLOT allows you to illustrate different diagrams of different types in one picture.
Line diagrams next to areal charts with static and possibly dynamic parts.
Picture series:
Both line and area chart definitions can request the creation of picture series.
A picture can contain static and dynamic image components.
Dynamic components means parts of the image that vary over a picture series.
The following rule applies to the program:
The first read dynamic definition determines the permitted length of the
picture series.
The program aborts, if a further dynamic diagram definition results a
different number of images.
Further tests are not carried out.
Different series diagrams from dynamic diagram definitions of the same
length are processed by the program. The static picture elements are displayed
on every picture in the series.
Input-Files
- general input data (file type ncplot.dat)
- result files (file type CF-NETCDF.NC)
- file with interval definitions for color legends (file type bounds.cfg.dat)
Hint: (Recommended) Local configuration file or file from the directory $PROGHOME/cfg/. - file with list of definitions of palettes (file type palettes.cfg.dat)
Hint: (Recommended) Provided file from the directory $PROGHOME/cfg/ or local configuration file. - file with definitions of colors (file type colors.cfg.dat)
Hint: (Recommended) Provided file from the directory $PROGHOME/cfg/ or local configuration file.
For NCPLOT the following standard configuration files from the directory $PROGHOME/cfg/ are required:
- GKS parameter file: gkssystem.computername.dat
Output-Files
- plot metafiles (CGM format)
- (optional) informative printer file of program execution (file type ncplot.sdr)
- (optional) trace of program execution (file type ncplot.trc)
Methodology
NCPLOT is a pure plot program without any user interaction at runtime.
The layout of the picture and the graphical presentation of the data has to be
described in the steering file.
NCPLOT creates vector graphics in CGM format.
For special data files it is possible to exclude data at places with low water
coverage from the display. The technic works only on original UnTRIM result files
in CF NetCDF format.
Just in case HDF error is detected during read of a data record,
the program tries to reconstruct the wanted data set from adjacent (in time)
records for the same variable.
This type of repair works for time dependent variables only.
Program(s) to run before this Program
DATACONVERT, GRIDCONVERT, NCAGGREGATE, NCANALYSE, NCCUTOUT, NCDELTA, UNK, UNTRIM2007, UNTRIM2
Program(s) to run after this Program
---
Additional Information
Language
Fortran95
Additional software
GKS (by GTS-Gral)
Original Version
Maintenance
Documentation/Literature
template files available in $PROGHOME/examples/ncplot
back to Program Descriptions
