NCPLOT: Example Figures Area Chart Map View: Difference between revisions
From BAWiki
imported>Spohr Susanne Created page with "de:NCPLOT: Beispiel-Grafiken Draufsicht The sample pictures should give an impression of the capability of the program NCPLOT. =Examples= ===Visualisation of "node"..." |
imported>Spohr Susanne m NOAUTOLINKS |
||
| Line 1: | Line 1: | ||
__NOAUTOLINKS__ | |||
__NOAUTOLINKTARGET__ | |||
[[de:NCPLOT: Beispiel-Grafiken Draufsicht]] | [[de:NCPLOT: Beispiel-Grafiken Draufsicht]] | ||
The sample pictures should give an impression of the capability of the program [[NCPLOT]]. | The sample pictures should give an impression of the capability of the program [[NCPLOT]]. | ||
Latest revision as of 08:54, 5 July 2018
The sample pictures should give an impression of the capability of the program NCPLOT.
Examples
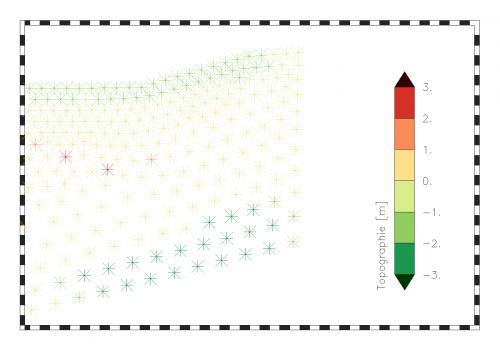
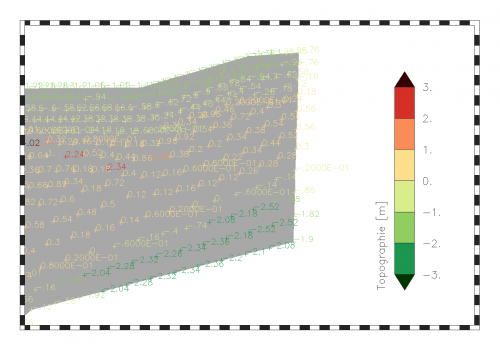
Visualisation of "node" data
| Node data visualized by marker symbols | Node data with text symbolization |
|---|---|
 |
 |
Visualisation of "edge" data
Visualisation of "face" data
| Face data visualized by marker symbols | Face data with fill area symbolization |
|---|---|
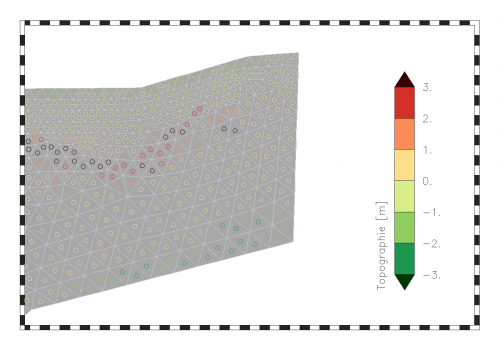 |
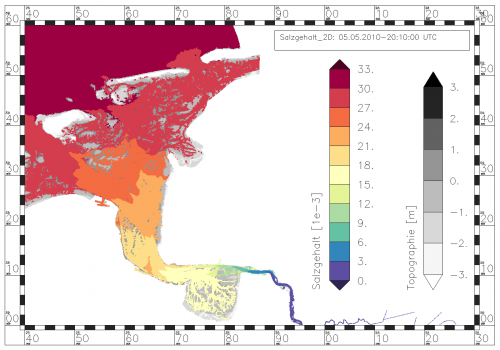 |
Show the calculation grid
| Water level without grid | Water level with overlaid grid |
|---|---|
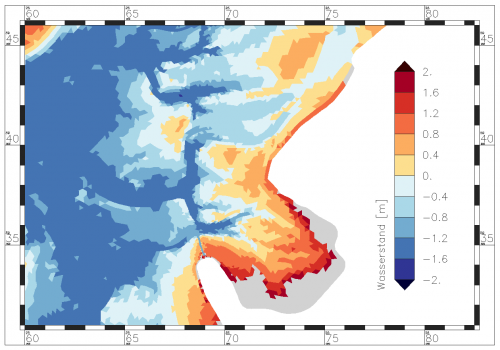 |
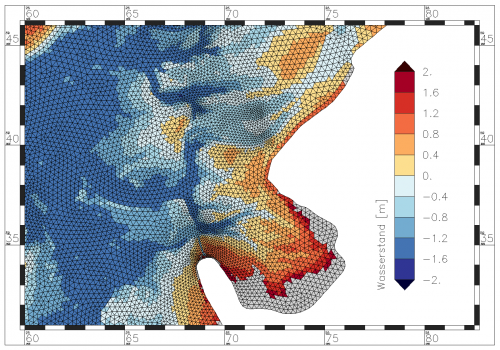 |
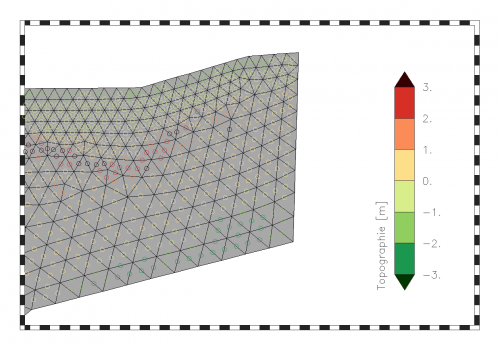
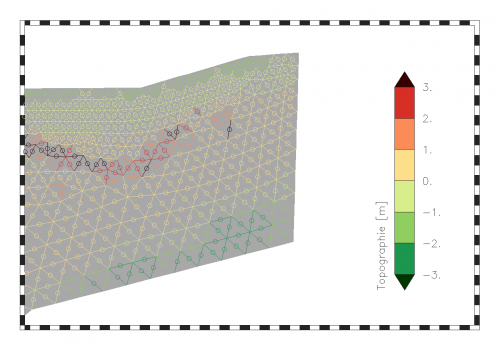
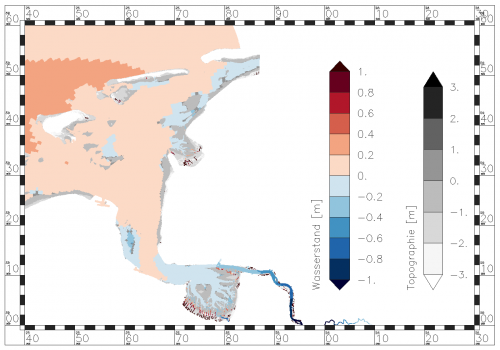
Data with subgrid information
| Topography with details on a subgrid | Water level on subgrid topography |
|---|---|
 |
 |
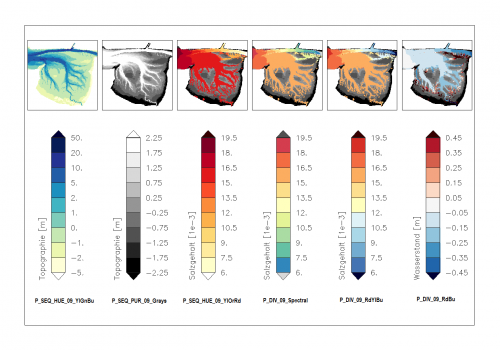
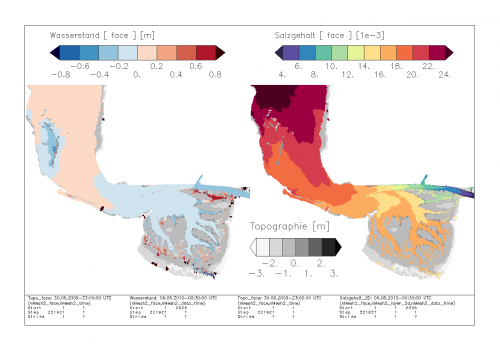
Multiple maps in one picture
| Comparison of water level and salinity | Collection of suitable color ramps |
|---|---|
 |
 |
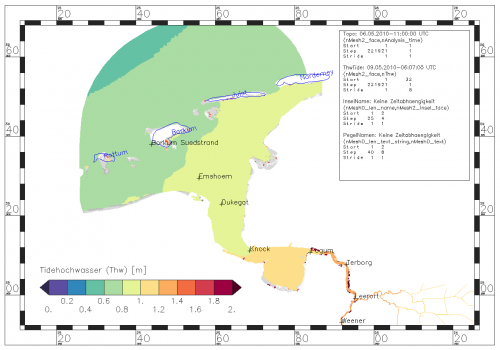
Data description and visualization of text
| Description of data sets | Visualization of text data |
|---|---|
 |
 |
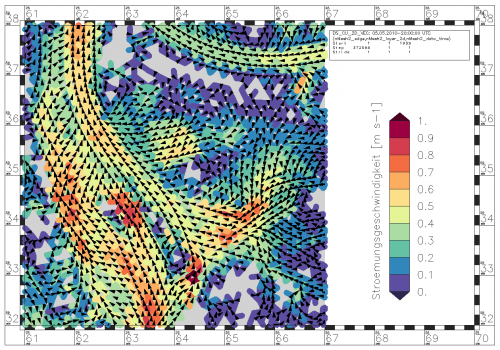
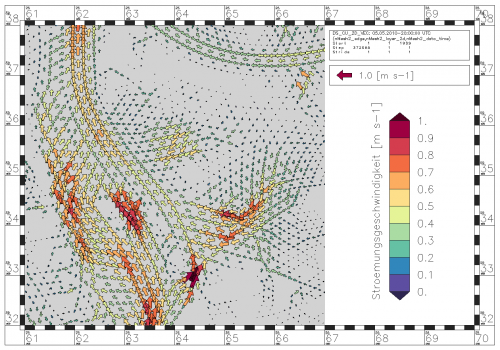
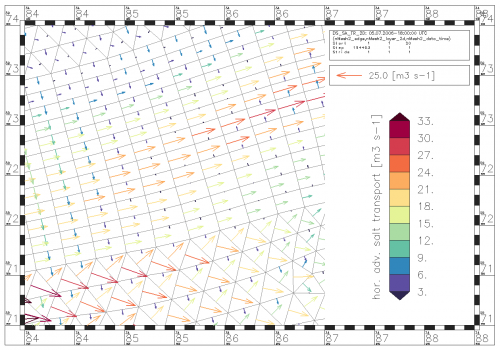
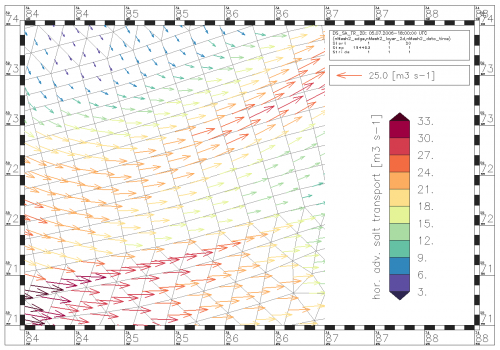
Visualisation of vector quantities
Visualisation of normal component of vector quantities
back to NCPLOT: Area Charts

