NCPLOT: Example figures: Difference between revisions
From BAWiki
imported>Spohr Susanne Created page with 'de:Beispiel-Grafiken: NCPLOT The sample pictures should give an impression of the capability of the program NCPLOT. =Examples= ===Visualisation of "node" data=== {| bor…' |
imported>Spohr Susanne + Data description and visualization of text |
||
| Line 61: | Line 61: | ||
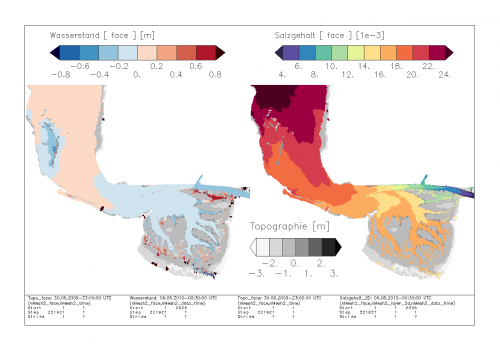
|[[File:NcplotBspTwo_Maps.png|center|500px|Comparison of water level and salinity]] | |[[File:NcplotBspTwo_Maps.png|center|500px|Comparison of water level and salinity]] | ||
|[[File:NcplotBspBestPals.png|center|500px|Collection of particularly suitable color ramps]] | |[[File:NcplotBspBestPals.png|center|500px|Collection of particularly suitable color ramps]] | ||
|} | |||
<br /> | |||
===Data description and visualization of text=== | |||
{| border="1" | |||
! width="50%" | Description of data sets | |||
! width="50%" | Visualization of text data | |||
|- | |||
|[[File:NcplotBspDataDesc.png|center|500px|Descriptions of the shown data sets]] | |||
|[[File:NcplotBspTextData.png|center|500px|Representation of geo-referenced texts from text variables]] | |||
|} | |} | ||
<br /> | <br /> | ||
Revision as of 08:49, 16 July 2013
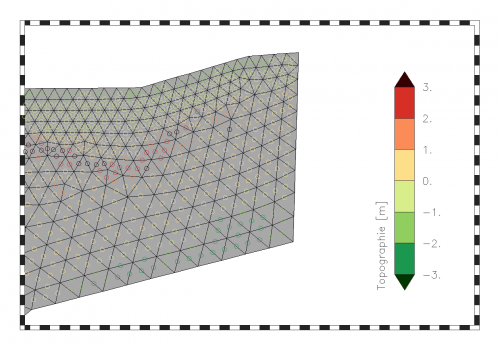
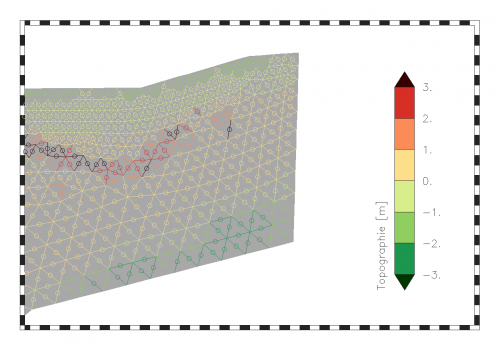
The sample pictures should give an impression of the capability of the program NCPLOT.
Examples
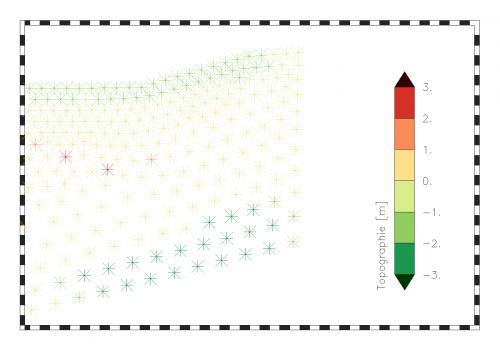
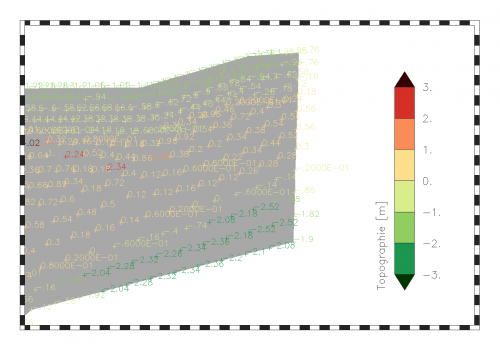
Visualisation of "node" data
| Node data visualized by marker symbols | Node data with text symbolization |
|---|---|
 |
 |
Visualisation of "edge" data
Visualisation of "face" data
| Face data visualized by marker symbols | Face data with fill area symbolization |
|---|---|
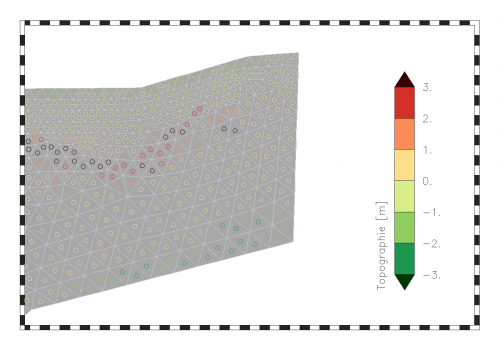 |
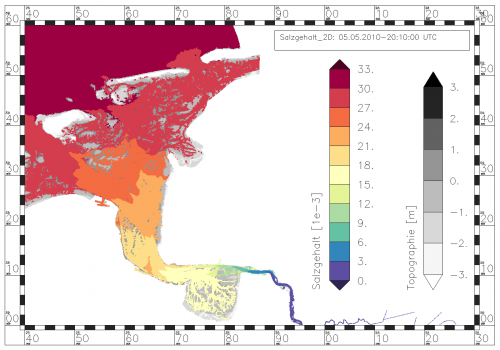 |
Show the calculation grid
| Water level without grid | Water level with overlaid grid |
|---|---|
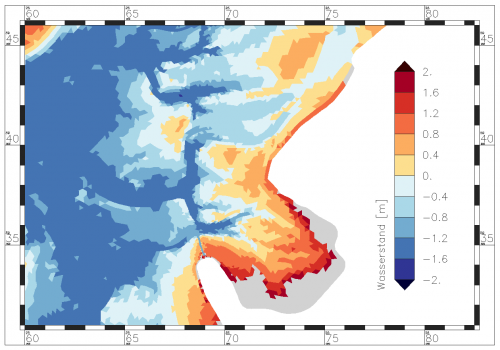 |
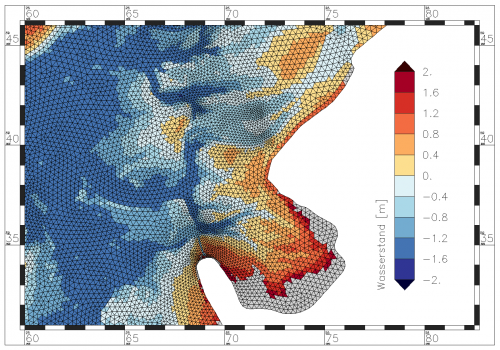 |
Data with subgrid information
| Topography with details on a subgrid | Water level on subgrid topography |
|---|---|
 |
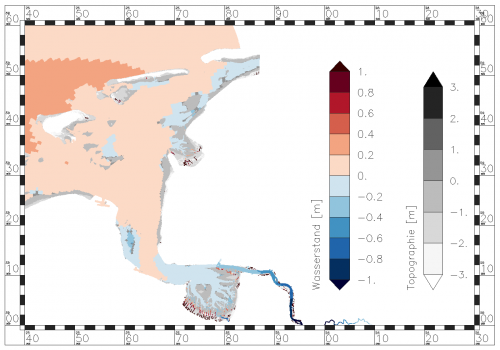 |
Multiple maps in one picture
| Comparison of water level and salinity | Collection of suitable color ramps |
|---|---|
 |
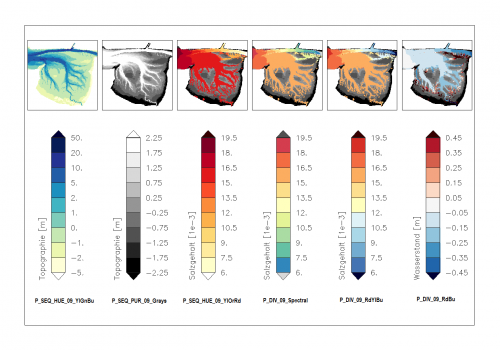 |
Data description and visualization of text
| Description of data sets | Visualization of text data |
|---|---|
 |
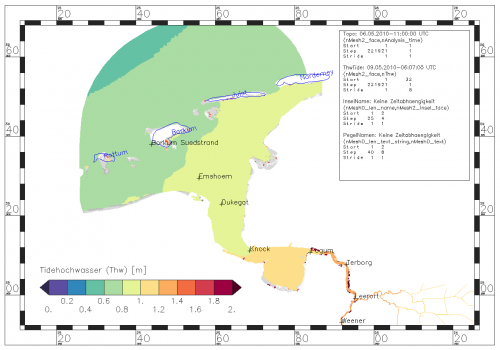 |
back to NCPLOT

