NCPLOT: Difference between revisions
From BAWiki
imported>Spohr Susanne Created page with '{{ProgramDescription |name_de=NCPLOT |name=NCPLOT |version=March 2013 |version_descr=March 2013 |catchwords=graphical postprocessor<br /> graphical presentation of CF NetCDF data…' |
imported>Spohr Susanne mNo edit summary |
||
| Line 40: | Line 40: | ||
|inputfiles= | |inputfiles= | ||
# '''general input data''' (file type [[NCPLOT | # '''general input data''' (file type [[NCPLOT.DAT|ncplot.dat]]) | ||
# '''result files''' (file type [[CF-NETCDF.NC]]) | # '''result files''' (file type [[CF-NETCDF.NC]]) | ||
# file with '''interval definitions''' for color legends (file type [[BOUNDS.CFG.DAT|bounds.cfg.dat]]) <br />Hint: (Recommended) Local configuration file or file from the directory ''$PROGHOME/cfg/''. | # file with '''interval definitions''' for color legends (file type [[BOUNDS.CFG.DAT|bounds.cfg.dat]]) <br />Hint: (Recommended) Local configuration file or file from the directory ''$PROGHOME/cfg/''. | ||
Revision as of 15:49, 22 March 2013
Basic Information
Name of Program
NCPLOT
Version-Date
March 2013
Description-Date
March 2013
Catchwords
graphical postprocessor
graphical presentation of CF NetCDF data (2D/3D)
finite element models
finite difference models
orthogonal unstructured grid model
orthogonal unstructured grid model with subgrid information
Short Description of Functionality
The graphical postprocessor NCPLOT can be used for a scaled graphical presentation
of CF NetCDF data. Different scalar quantities can be visualized in the horizontal plane. The
data can be defined on nodes, edges or faces. The program works on 2D-data, 3D-data and on data with
details scaled on a subgrid.
The presentation of vector quantities is currently not implemented.

NCPLOT is a pure plot program without any user interaction at runtime. The layout of the picture and the graphical presentation of the data has to be described in the steering file.
The visualisation of a data set is described in a so-called 'layer'. The assignment of colors to values of a data set and the form of representation of the underlying geometry are set in one layer block of the steering file. Color legends used by a layer can be displayed on the scene and can be arranged horizontally or vertically. Another layer dependent, optional image element is a text field for the data label (e.g. Indication of the time).
Different layers can be plotted in a map lying upon each other. Each map can be framed. The type of frame can be a simple black edging or a complex frame with coordinates. The offered coordinate frames are optimized for values belonging to Gauss Krüger projection. Different maps can be arranged in one picture.
NCPLOT creates vector graphics in CGM format.
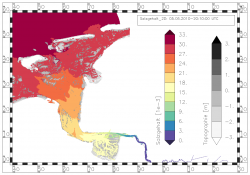
The sample pictures illustrate the capability of the program NCPLOT.
Example figures: NCPLOT
Input-Files
- general input data (file type ncplot.dat)
- result files (file type CF-NETCDF.NC)
- file with interval definitions for color legends (file type bounds.cfg.dat)
Hint: (Recommended) Local configuration file or file from the directory $PROGHOME/cfg/. - file with list of definitions of palettes (file type palettes.cfg.dat)
Hint: (Recommended) Provided file from the directory $PROGHOME/cfg/ or local configuration file. - file with definitions of colors (file type colors.cfg.dat)
Hint: (Recommended) Provided file from the directory $PROGHOME/cfg/ or local configuration file.
For NCPLOT the following standard configuration files from the directory $PROGHOME/cfg/ are required:
- GKS parameter file: gkssystem.computername.dat
Output-Files
- plot metafiles (CGM format)
- (optional) informative printer file of program execution (file type ncplot.sdr)
- (optional) trace of program execution (file type ncplot.trc)
Methodology
The data are presented by the program at their original positions (node, edge, face). A horizontal interpolation of the data is not yet possible. Node data can be visualized by marker symbols or text. Edge data can be visualized by line symbolization and face data can be presented by using a fill area symbolization. For edge and polygon data, there are also the possibilities of point-symbolization. In this case the marker or the text is positioned at the middle of the edge or at the polygon center. The edges of polygons can be also visualized by lines symbolization.
For special data files it is possible to exclude data at places with low water coverage from the display. The technic works only on original UnTRIM result files in CF NetCDF format.
Program(s) to run before this Program
DATACONVERT, GRIDCONVERT, UNTRIM2007, UNTRIM2
Program(s) to run after this Program
---
Additional Information
Language
Fortran95
Additional software
GKS (by GTS-Gral)
Original Version
Maintenance
Documentation/Literature
template files available in $PROGHOME/examples/ncplot
back to Program Descriptions
