NCPLOT: Example figures: Difference between revisions
From BAWiki
imported>Spohr Susanne + Visualisation of vector quantities |
imported>Spohr Susanne + Example: total vector from normal component |
||
| Line 81: | Line 81: | ||
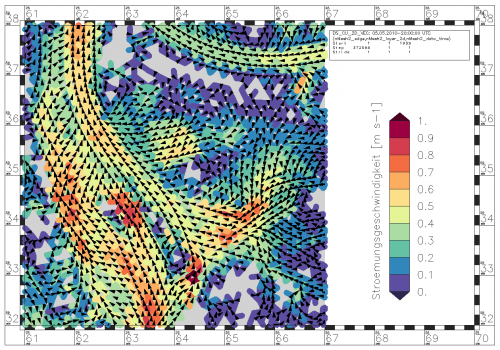
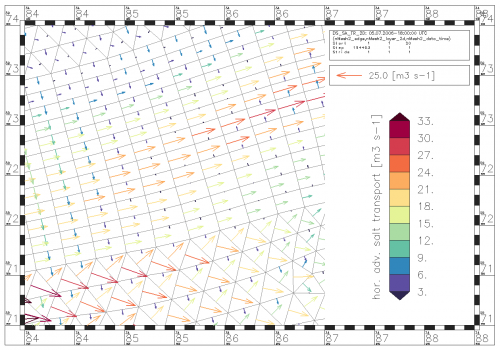
|[[File:NcplotBspVecTriCCS.png|center|500px|Triangles of constant length overlie the colored map of the magnitude of current velocity]] | |[[File:NcplotBspVecTriCCS.png|center|500px|Triangles of constant length overlie the colored map of the magnitude of current velocity]] | ||
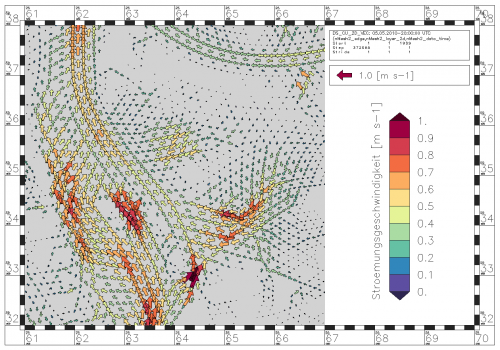
|[[File:NcplotBspVecArdPP.png|center|500px|Color and size of the arrows vary with the magnitude of current velocity]] | |[[File:NcplotBspVecArdPP.png|center|500px|Color and size of the arrows vary with the magnitude of current velocity]] | ||
|} | |||
<br /> | |||
===Visualisation of normal component of vector quantities=== | |||
{| border="1" | |||
! width="50%" | Normal vector | |||
! width="50%" | Total vector | |||
|- | |||
|[[File:NcplotBspVecNV.png|center|500px|Representation of the normal component of a vector quantity (present at the edges)]] | |||
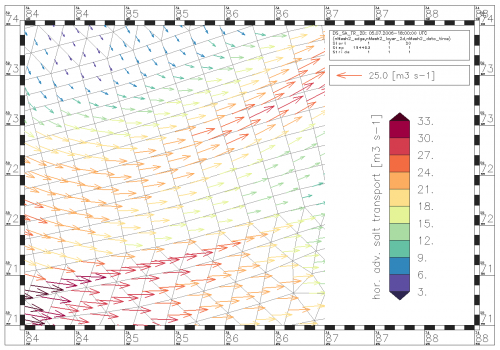
|[[File:NcplotBspVecTV.png|center|500px|Representation of total vectors interpolated from the normal component of a vector quantity]] | |||
|} | |} | ||
<br /> | <br /> | ||
Revision as of 14:02, 21 February 2014
The sample pictures should give an impression of the capability of the program NCPLOT.
Examples
Visualisation of "node" data
| Node data visualized by marker symbols | Node data with text symbolization |
|---|---|
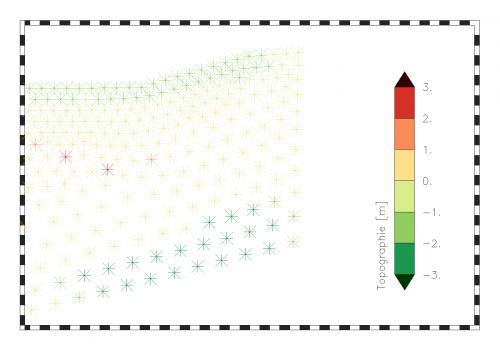 |
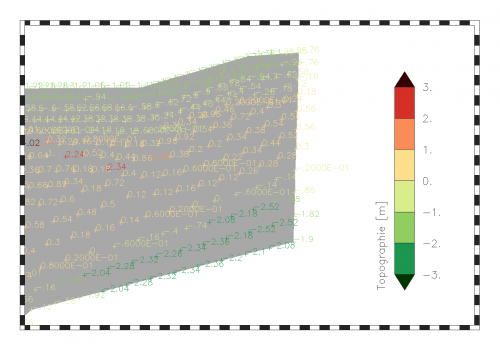 |
Visualisation of "edge" data
Visualisation of "face" data
| Face data visualized by marker symbols | Face data with fill area symbolization |
|---|---|
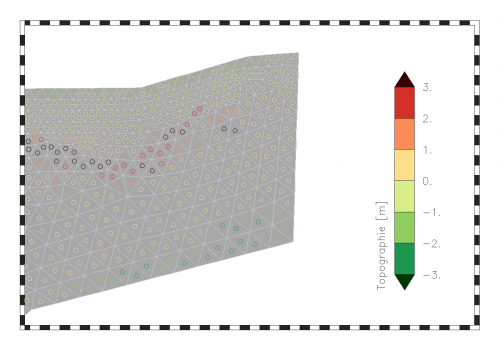 |
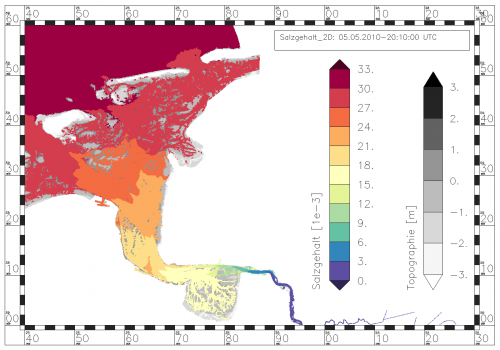 |
Show the calculation grid
| Water level without grid | Water level with overlaid grid |
|---|---|
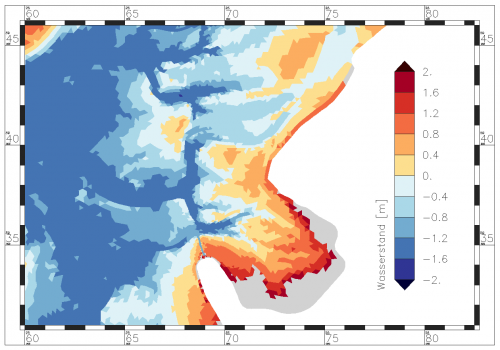 |
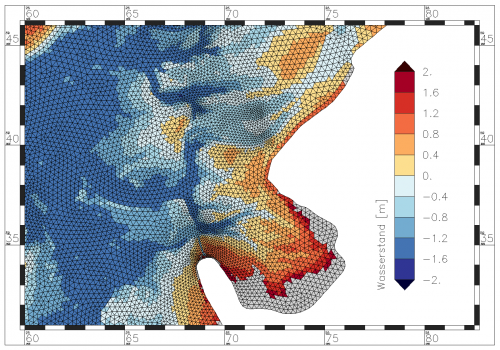 |
Data with subgrid information
| Topography with details on a subgrid | Water level on subgrid topography |
|---|---|
 |
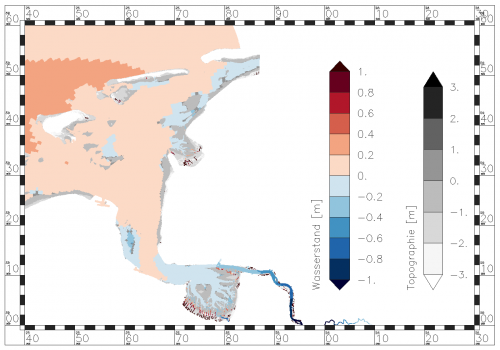 |
Multiple maps in one picture
| Comparison of water level and salinity | Collection of suitable color ramps |
|---|---|
 |
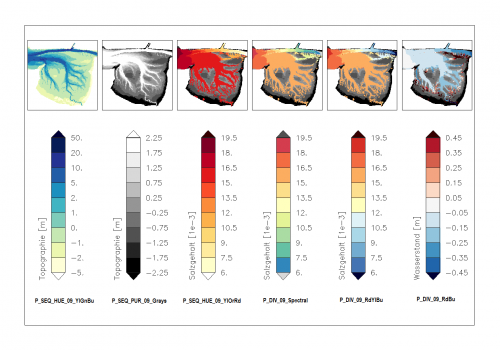 |
Data description and visualization of text
| Description of data sets | Visualization of text data |
|---|---|
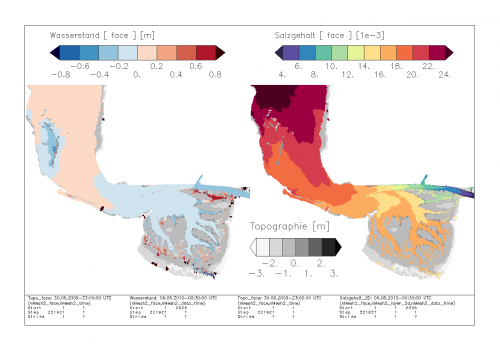 |
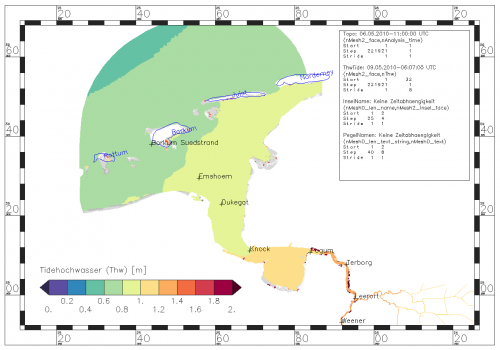 |
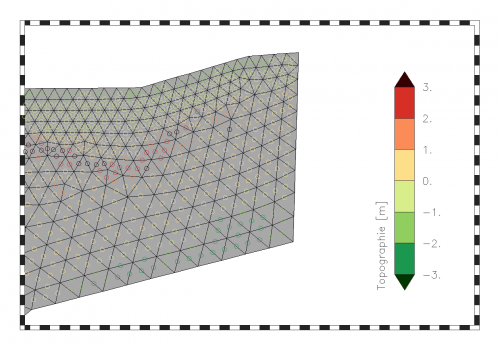
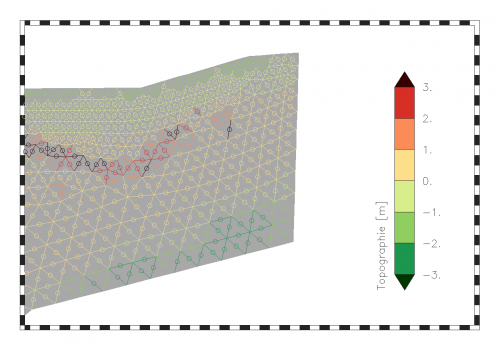
Visualisation of vector quantities
Visualisation of normal component of vector quantities
back to NCPLOT

