Immersive Visualisation: Difference between revisions
From BAWiki
imported>Mueller-hagedorn Created page with 'de:Immersive Visualisierung thumb|Bild 1: Visualisierung des Rheins bei Emmerich [[File: BAWiki_immersiveVisualisierung_…' |
The LinkTitles extension automatically added links to existing pages (<a target="_blank" rel="nofollow noreferrer noopener" class="external free" href="https://github.com/bovender/LinkTitles">https://github.com/bovender/LinkTitles</a>). |
||
| Line 2: | Line 2: | ||
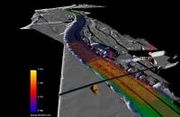
[[File: BAWiki_immersiveVisualisierung_emmerich.jpg|thumb|Bild 1: Visualisierung des Rheins bei Emmerich]] | [[File: BAWiki_immersiveVisualisierung_emmerich.jpg|thumb|Bild 1: Visualisierung des Rheins bei Emmerich]] | ||
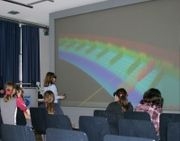
[[File: BAWiki_immersiveVisualisierung_girlsday3.jpg|thumb|Bild 2: Vorführung der immersiven Visualisierungsanlage beim Girl's-Day]] | [[File: BAWiki_immersiveVisualisierung_girlsday3.jpg|thumb|Bild 2: Vorführung der immersiven Visualisierungsanlage beim Girl's-Day]] | ||
The sections of federal waterways modelled with multi-dimensional numerical methods are growing increasingly and the resolution of the models is becoming even finer. Thanks to improved data recording techniques and the large capacity of computers, the wealth of detail is expanding. The quality of processed field data – such as digital terrain models – is harder than ever to control. At the same time, the modelling results permit numerous conclusions to be drawn about the natural system. Pre- and post-processing of models thus now takes up the majority of the time required for processing the tasks with the help of mathematical methods. The classic “2 1/2”-dimensional visualisation techniques at a personal computer work station permit only restricted work on pre- and post-processing because of the size of the models and the volume of data. On the one hand, large models are frequently unclear, making it difficult to check the correct discretisation of the geometry of the models, the selected assignments of the parameters and the choice of initial conditions. On the other hand, the information content of the model results can only be fully extracted with a great deal of time and effort. It becomes increasingly difficult for the modeller to convey the full information content of the model results to clients, decision makers or interested members of the professional public. | The sections of federal waterways modelled with multi-dimensional [[Numerical Methods|numerical methods]] are growing increasingly and the resolution of the models is becoming even finer. Thanks to improved data recording techniques and the large capacity of computers, the wealth of detail is expanding. The quality of processed field data – such as digital terrain models – is harder than ever to control. At the same time, the modelling results permit numerous conclusions to be drawn about the natural system. Pre- and post-processing of models thus now takes up the majority of the time required for processing the tasks with the help of [[Mathematical Methods|mathematical methods]]. The classic “2 1/2”-dimensional visualisation techniques at a personal computer work station permit only restricted work on pre- and post-processing because of the size of the models and the volume of data. On the one hand, large models are frequently unclear, making it difficult to check the correct discretisation of the geometry of the models, the selected assignments of the parameters and the choice of initial conditions. On the other hand, the information content of the [[model]] results can only be fully extracted with a great deal of time and effort. It becomes increasingly difficult for the modeller to convey the full information content of the [[model]] results to clients, decision makers or interested members of the professional public. | ||
For this reason, the BAW has for some years been using the technique of large-scale immersive visualisation for large data sets. This technique is based on the fact that in natural vision, the eyes form a picture from two different angles of vision, which our brain then transforms into an overall image, using information with regard to the depth of the picture. Using special projectors, the multi-dimensional data sets are projected onto a screen which completely fills the field of vision. To avoid throwing a shadow, a backward projection method was chosen. A colour coding technique calculates an image for the right eye from a different angle of vision than that for the left eye. A special pair of eye glasses then separates the two images again, so that each eye can see only one image. The colour coding means that each eye can perceive the full range of colours. This creates the impression of a three-dimensional picture of the data set in which online navigation can be carried out with the help of a pointer (“laser sword”) and/or head tracking. | For this reason, the BAW has for some years been using the technique of large-scale immersive visualisation for large data sets. This technique is based on the fact that in natural vision, the eyes form a picture from two different angles of vision, which our brain then transforms into an overall image, using information with regard to the depth of the picture. Using special projectors, the multi-dimensional data sets are projected onto a screen which completely fills the field of vision. To avoid throwing a shadow, a backward [[projection]] method was chosen. A colour coding technique calculates an image for the right eye from a different angle of vision than that for the left eye. A special pair of eye glasses then separates the two images again, so that each eye can see only one image. The colour coding means that each eye can perceive the full range of colours. This creates the impression of a three-dimensional picture of the data set in which online [[navigation]] can be carried out with the help of a pointer (“laser sword”) and/or head tracking. | ||
The size and three-dimensionality of the projection completely fill the viewer’s field of vision. Periphery vision is activated and all optical distractions which are otherwise located around the screen are eliminated. The perception of the data thus becomes intuitive. The size of the depiction and the online navigation in the data set permit visually supported exploration of data and decision making in the team without the limitations of a discussion around a single monitor. The programme systems Covise from the company Visenso and Ensight from the company CEI are used for large-scale immersive stereo visualisation. | The size and three-dimensionality of the [[projection]] completely fill the viewer’s field of vision. Periphery vision is activated and all optical distractions which are otherwise located around the screen are eliminated. The perception of the data thus becomes intuitive. The size of the depiction and the online [[navigation]] in the data set permit visually supported exploration of data and decision making in the team without the limitations of a discussion around a single monitor. The programme systems Covise from the company Visenso and Ensight from the company CEI are used for large-scale immersive stereo visualisation. | ||
---- | ---- | ||
back to [[Pre- and Postprocessing ]] | back to [[Pre- and Postprocessing ]] | ||
Latest revision as of 10:17, 21 October 2022


The sections of federal waterways modelled with multi-dimensional numerical methods are growing increasingly and the resolution of the models is becoming even finer. Thanks to improved data recording techniques and the large capacity of computers, the wealth of detail is expanding. The quality of processed field data – such as digital terrain models – is harder than ever to control. At the same time, the modelling results permit numerous conclusions to be drawn about the natural system. Pre- and post-processing of models thus now takes up the majority of the time required for processing the tasks with the help of mathematical methods. The classic “2 1/2”-dimensional visualisation techniques at a personal computer work station permit only restricted work on pre- and post-processing because of the size of the models and the volume of data. On the one hand, large models are frequently unclear, making it difficult to check the correct discretisation of the geometry of the models, the selected assignments of the parameters and the choice of initial conditions. On the other hand, the information content of the model results can only be fully extracted with a great deal of time and effort. It becomes increasingly difficult for the modeller to convey the full information content of the model results to clients, decision makers or interested members of the professional public. For this reason, the BAW has for some years been using the technique of large-scale immersive visualisation for large data sets. This technique is based on the fact that in natural vision, the eyes form a picture from two different angles of vision, which our brain then transforms into an overall image, using information with regard to the depth of the picture. Using special projectors, the multi-dimensional data sets are projected onto a screen which completely fills the field of vision. To avoid throwing a shadow, a backward projection method was chosen. A colour coding technique calculates an image for the right eye from a different angle of vision than that for the left eye. A special pair of eye glasses then separates the two images again, so that each eye can see only one image. The colour coding means that each eye can perceive the full range of colours. This creates the impression of a three-dimensional picture of the data set in which online navigation can be carried out with the help of a pointer (“laser sword”) and/or head tracking. The size and three-dimensionality of the projection completely fill the viewer’s field of vision. Periphery vision is activated and all optical distractions which are otherwise located around the screen are eliminated. The perception of the data thus becomes intuitive. The size of the depiction and the online navigation in the data set permit visually supported exploration of data and decision making in the team without the limitations of a discussion around a single monitor. The programme systems Covise from the company Visenso and Ensight from the company CEI are used for large-scale immersive stereo visualisation.
back to Pre- and Postprocessing
