GVIEW2D: Visualization of time series: Difference between revisions
From BAWiki
imported>Spohr Susanne Created page with 'de: GVIEW2D: Zeitreihen-Darstellung ==Example: Visualize measured data== Visualization of the measured fresh water discharge at gauging station Versen (river Ems) for the yea…' |
The LinkTitles extension automatically added links to existing pages (<a target="_blank" rel="nofollow noreferrer noopener" class="external free" href="https://github.com/bovender/LinkTitles">https://github.com/bovender/LinkTitles</a>). |
||
| Line 1: | Line 1: | ||
[[de: GVIEW2D: Zeitreihen-Darstellung]] | [[de: GVIEW2D: Zeitreihen-Darstellung]] | ||
==Example: Visualize measured data== | ==Example: Visualize measured data== | ||
Visualization of the measured fresh water discharge at gauging station Versen (river Ems) for the year 2000. | Visualization of the measured fresh water [[discharge]] at [[gauging station]] Versen (river Ems) for the year 2000. | ||
[[file:Ow2000-en.png|frame|none]] | [[file:Ow2000-en.png|frame|none]] | ||
==Example: Check boundary data== | ==Example: Check boundary data== | ||
Comparison of the input and output time series of the program UTRRND. In this case it is a water level comparison at a harbour inlet. | Comparison of the input and output time series of the program [[UTRRND]]. In this case it is a [[water level]] comparison at a [[harbour]] inlet. | ||
[[file:Rndw-en.png|frame|none]] | [[file:Rndw-en.png|frame|none]] | ||
==Example: Verify model data== | ==Example: Verify model data== | ||
Verification of Trim-2D model data in comparison with measured data. In this case it is a current velocity comparison (absolute value and direction) between measured data at a single position in the water column and at the equivalent model node (depth integrated model data!). | Verification of [[Trim]]-2D [[model]] data in comparison with measured data. In this case it is a current velocity comparison (absolute value and direction) between measured data at a single position in the water column and at the equivalent [[model]] node (depth integrated [[model]] data!). | ||
[[file:Veri-en.png|frame|none]] | [[file:Veri-en.png|frame|none]] | ||
==Example: Visualize postprocessed analysis data== | ==Example: Visualize postprocessed analysis data== | ||
Visualization of analysis data, computed by the hydrodynamic model TELEMAC-2D and postprocessed with the program Tdklf. You can see the flood and ebb current bed load transport for a selected data node of the north sea model near the mouth of the estuary Elbe. | Visualization of analysis data, computed by the hydrodynamic [[model]] [[TELEMAC-2D]] and postprocessed with the program [[TDKLF|Tdklf]]. You can see the [[flood]] and ebb current [[bed load]] transport for a selected data node of the north sea [[model]] near the mouth of the [[estuary]] Elbe. | ||
[[file:Analysis-en.png|frame|none]] | [[file:Analysis-en.png|frame|none]] | ||
---- | ---- | ||
back to [[GVIEW2D]] | back to [[GVIEW2D]] | ||
Latest revision as of 09:31, 21 October 2022
Example: Visualize measured data
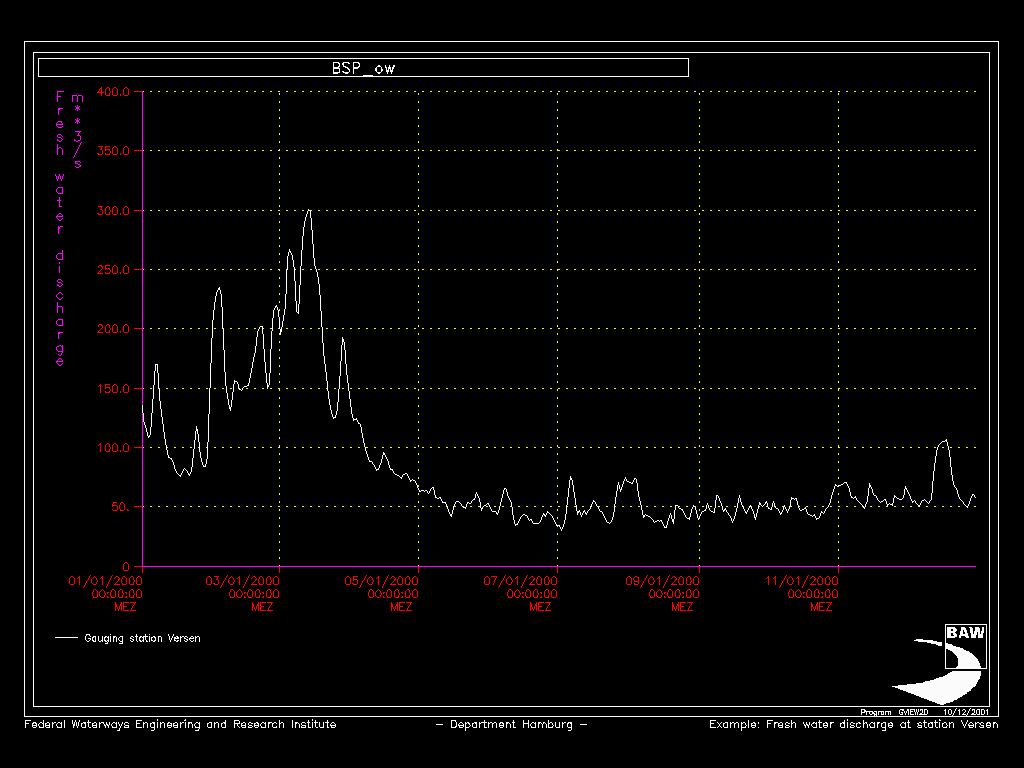
Visualization of the measured fresh water discharge at gauging station Versen (river Ems) for the year 2000.

Example: Check boundary data
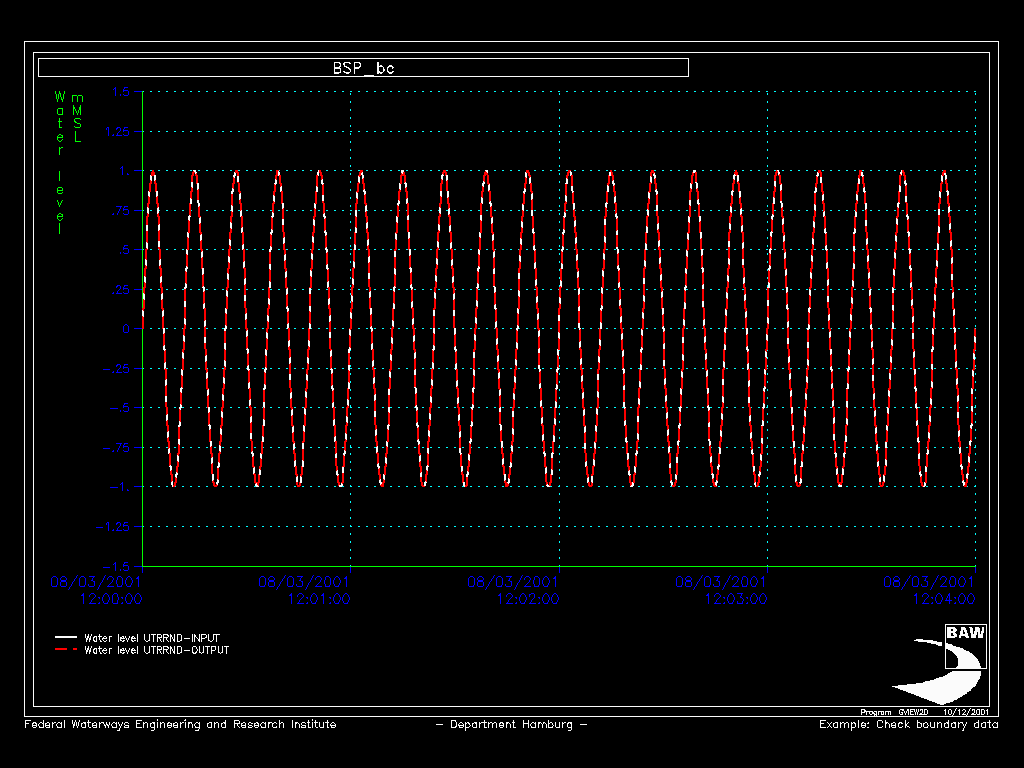
Comparison of the input and output time series of the program UTRRND. In this case it is a water level comparison at a harbour inlet.

Example: Verify model data
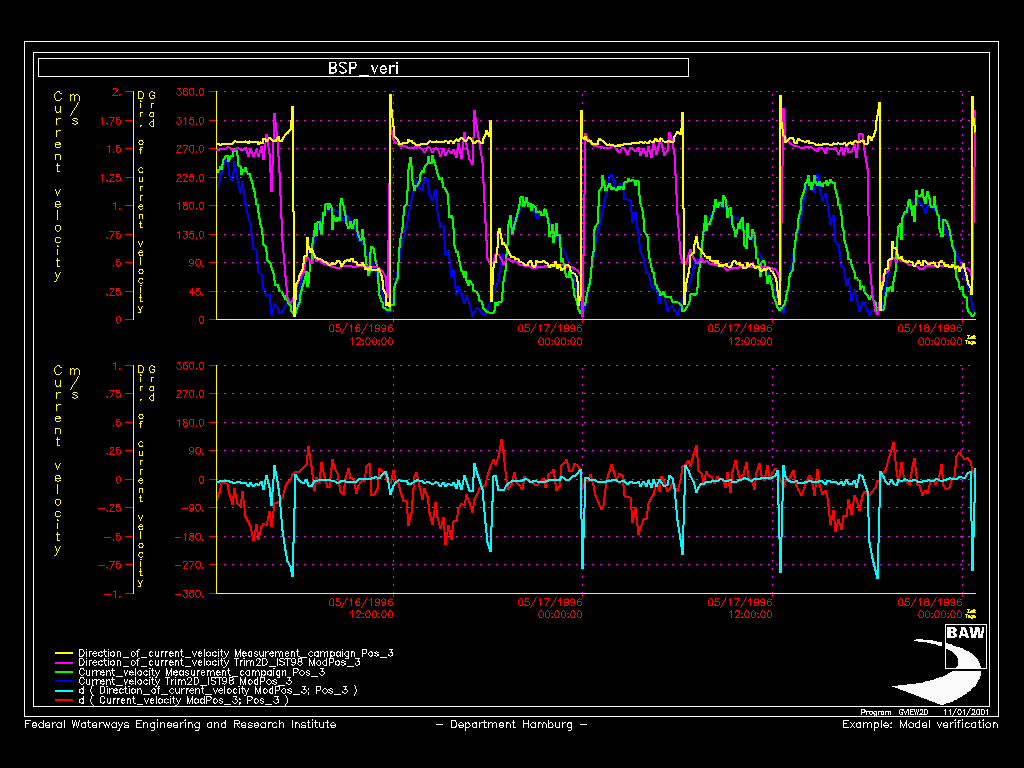
Verification of Trim-2D model data in comparison with measured data. In this case it is a current velocity comparison (absolute value and direction) between measured data at a single position in the water column and at the equivalent model node (depth integrated model data!).

Example: Visualize postprocessed analysis data
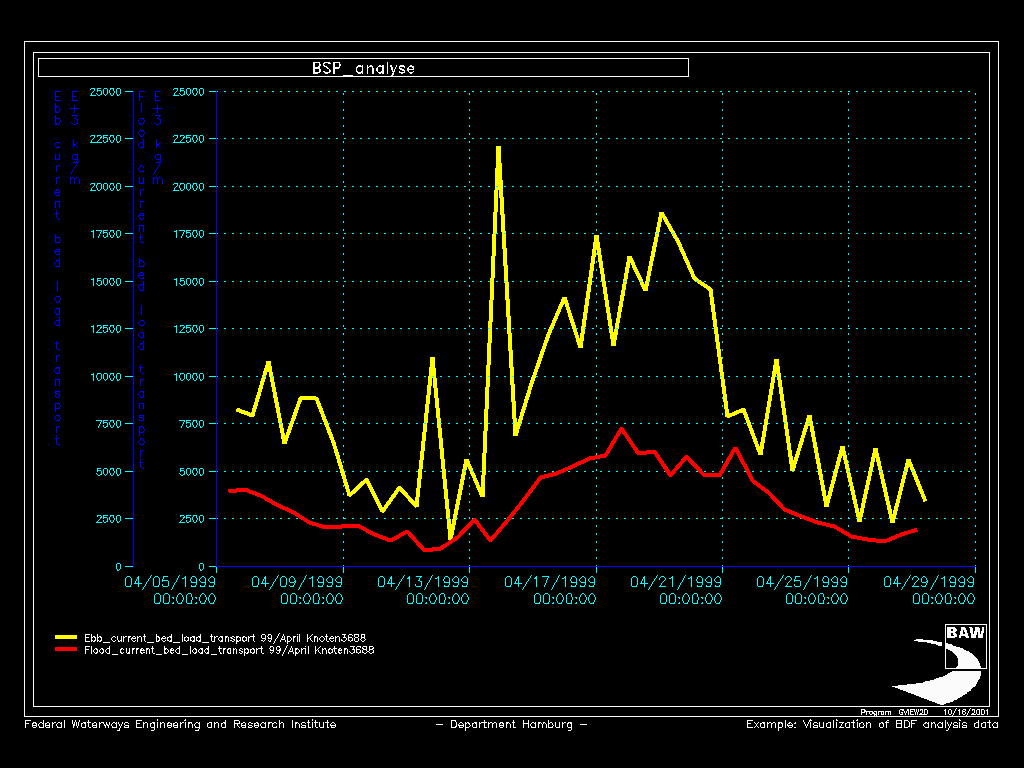
Visualization of analysis data, computed by the hydrodynamic model TELEMAC-2D and postprocessed with the program Tdklf. You can see the flood and ebb current bed load transport for a selected data node of the north sea model near the mouth of the estuary Elbe.

back to GVIEW2D
