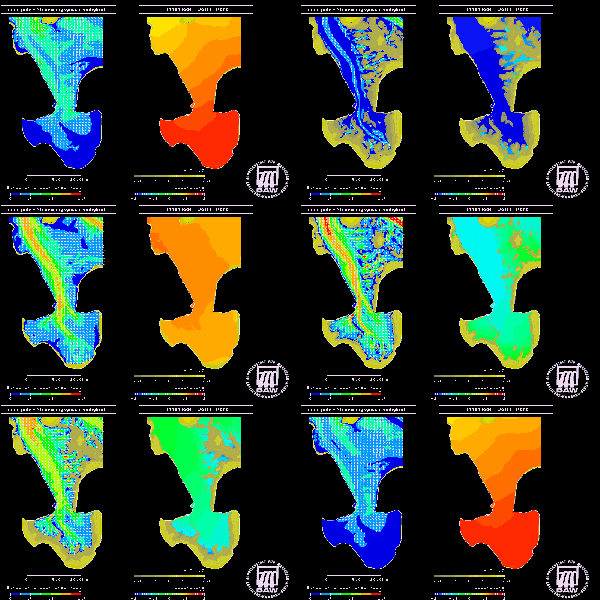
Example: Animation of Water Level Elevation and Flow Velocity in the Inner Jade Estuary
From BAWiki
This animation shows the temporal evolution of water-level elevation (right) and depth-averaged flow velocity (left) in the Inner Jade estuary along a double-tide, i.e. for 24 hours and 50 minutes. These quantities were computed using the hydro-numerical (HN) method TRIM-2D of the BAW-DH.
In the animation one can see the tidal wave moving into the domain as well as the dryfalling and flooding of mud flats. At tidal midwater, the maximum flow velocities are observed as expected. Furthermore it can be seen that the local slack water time is dependent on water depth and therefore varies with location. In deep regions of the topography values of slack water time generally lag behind compared to its values in shallow regions.
In addition to this animation, the Animation of fluid particle paths in the Inner Jade estuary shows how fluid particles travel within this flowfield. A list of further animations also of flows in other estuaries available from this server is found under Animations of calculated results.
This animation in Autodesk format can be downloaded from this site. The resolution is 800 x 600 pixel points (PAL) at 72 dpi
- Download Format
The animation player for the .flc file format can be downloaded through the link

