TRGITTER05: visualization examples of a Trim-2D-grid
From BAWiki
The following plots will show the functions of the program TRGITTER05 to visualize a Trim-2D grid:
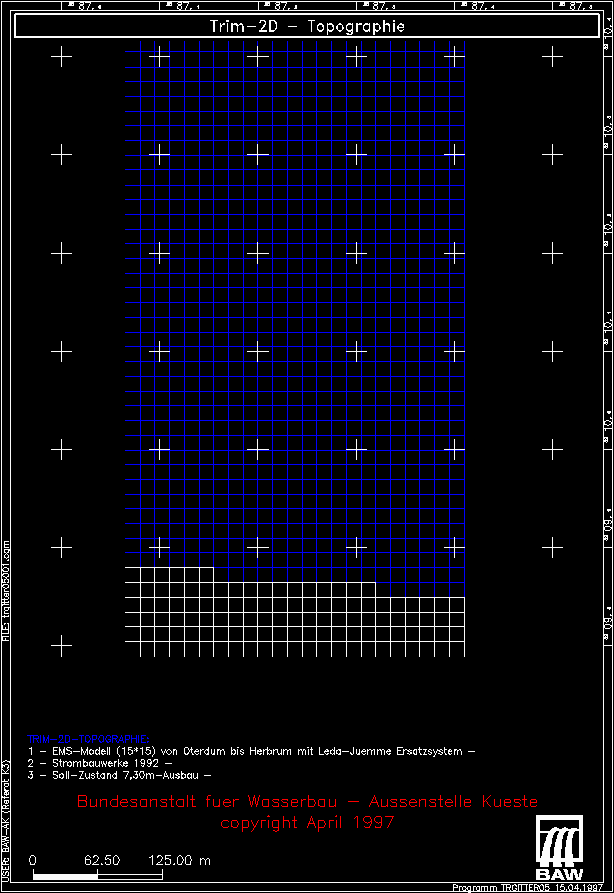
grid lines
Example of a visualization of wet (blue) and dry (white) grid lines. This plot shows a frame of a Trim-2D grid of the estuary Ems nearby Gandersum.
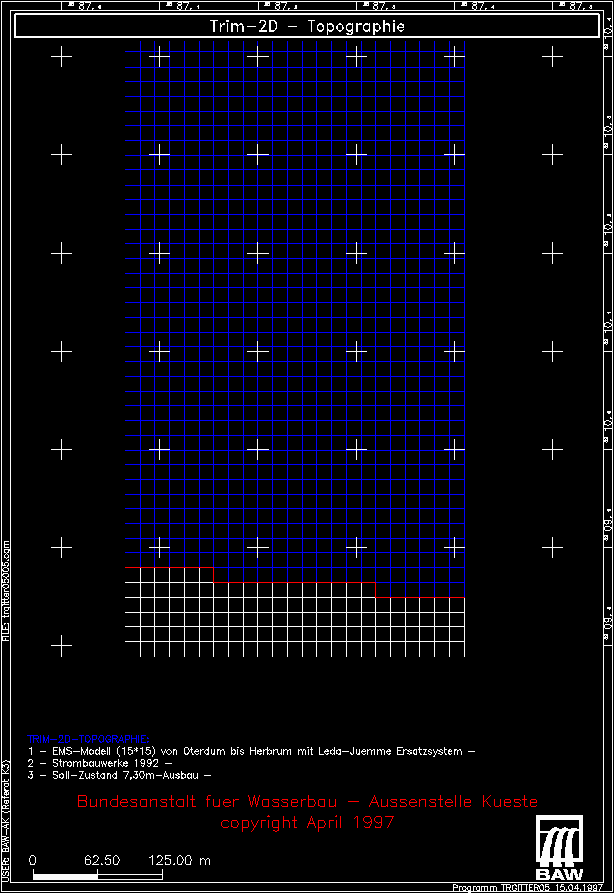
grid border + grid lines
Example of a visualization of a borderline (red) of a Trim-2D grid of the estuary Ems nearby Gandersum. Additional are shown the wet (blue) and dry (white) grid lines.
depth numbers + grid lines
Example of a visualization of zeta-point depth numbers inside every grid cell of a Trim-2D grid of the estuary Ems nearby Gandersum. The text colours are given by the topography colour table. Additional are shown the wet (blue) and dry (white) grid lines.

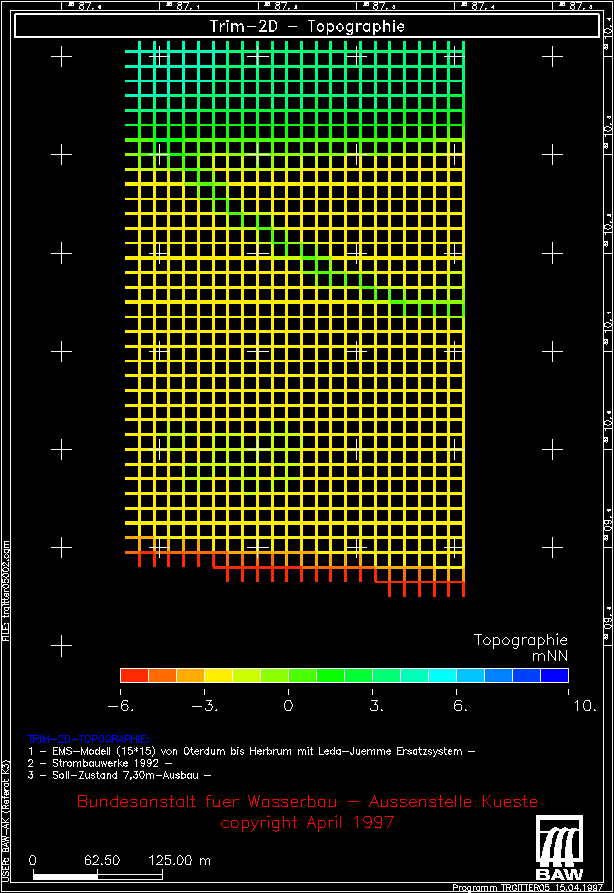
u- and v-depth edges
Example of a visualization of u- and v-edges coloured by the topography colour table. The frame shows a detail of the estuary Ems nearby Gandersum.
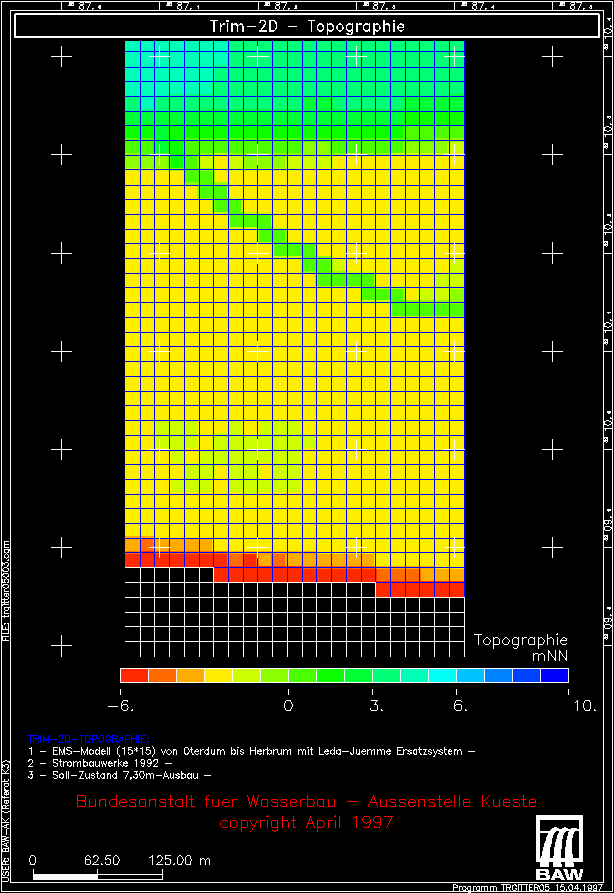
zeta-depth areas and u- and v-depth edges
Example of a visualization of zeta-point areas and u,v-depth edges coloured by the topography colour table. The frame shows a detail of the estuary Ems nearby Gandersum. First are drawn the zeta-point areas and then the u- and v-depth edges on top of the areas.

depth areas and edges + grid lines
Example of a visualization of zeta-point areas and u,v-depth edges coloured by the topography colour table. The frame shows a detail of the estuary Ems nearby Gandersum. First are drawn the zeta-point areas and then the u- and v-depth edges on top of the areas. Additional are shown the wet (blue) and dry (white) grid lines.
isolines
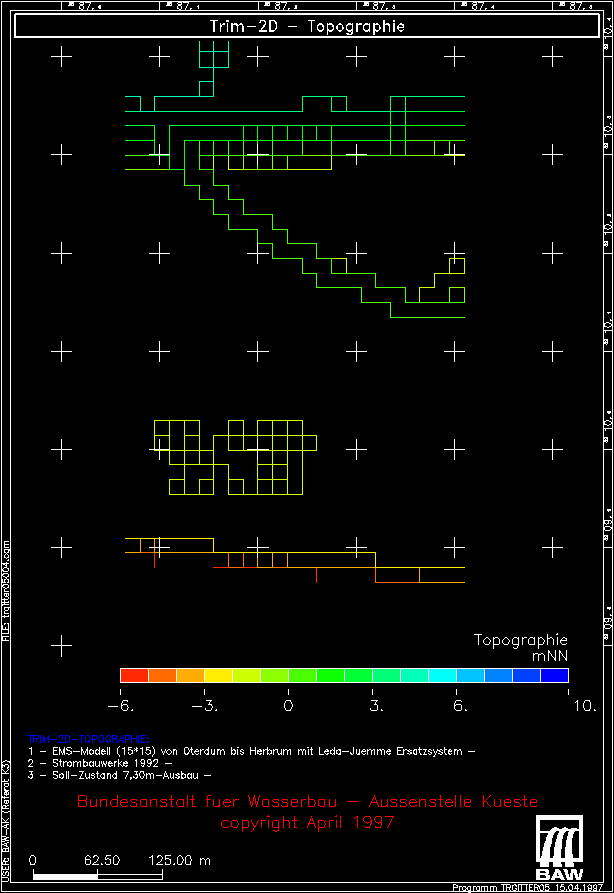
Example of a visualization of isolines coloured by the topography colour table. The frame shows a detail of the estuary Ems nearby Gandersum.
isolines + grid lines
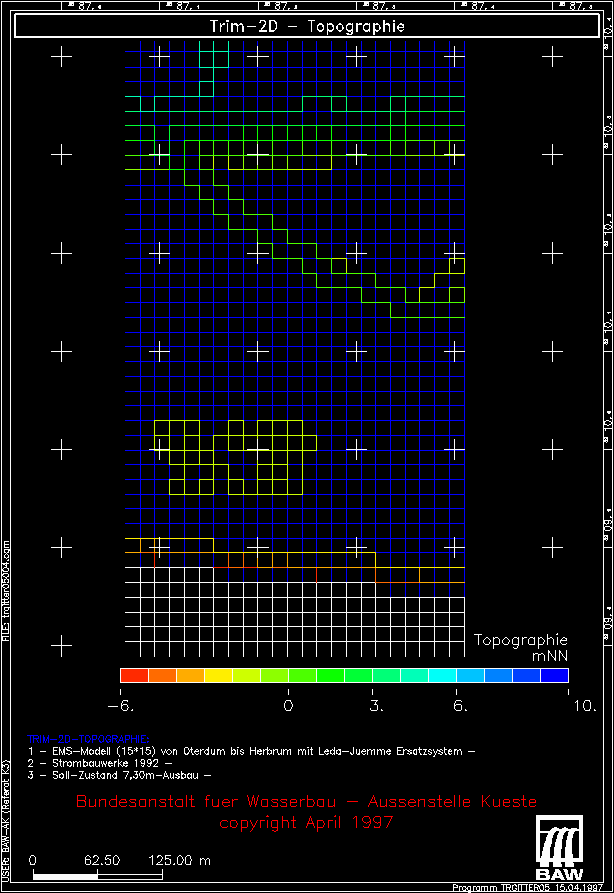
Example of a visualization of isolines coloured by the topography colour table. The frame shows a detail of the estuary Ems nearby Gandersum. Additional are shown the wet (blue) and dry (white) grid lines.
echo-sound data + grid lines
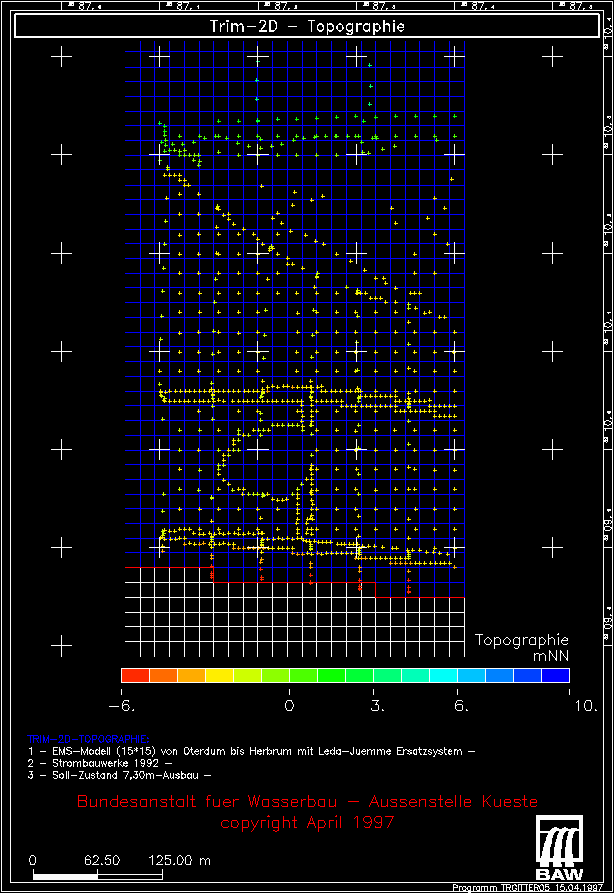
Example of a visualization of echo-sound data coloured by the topography colour table. The frame shows a detail of the estuary Ems nearby Gandersum. Additional are shown the wet (blue) and dry (white) grid lines.
back to TRGITTER05
