GVIEW2D: Visualization of time series
From BAWiki
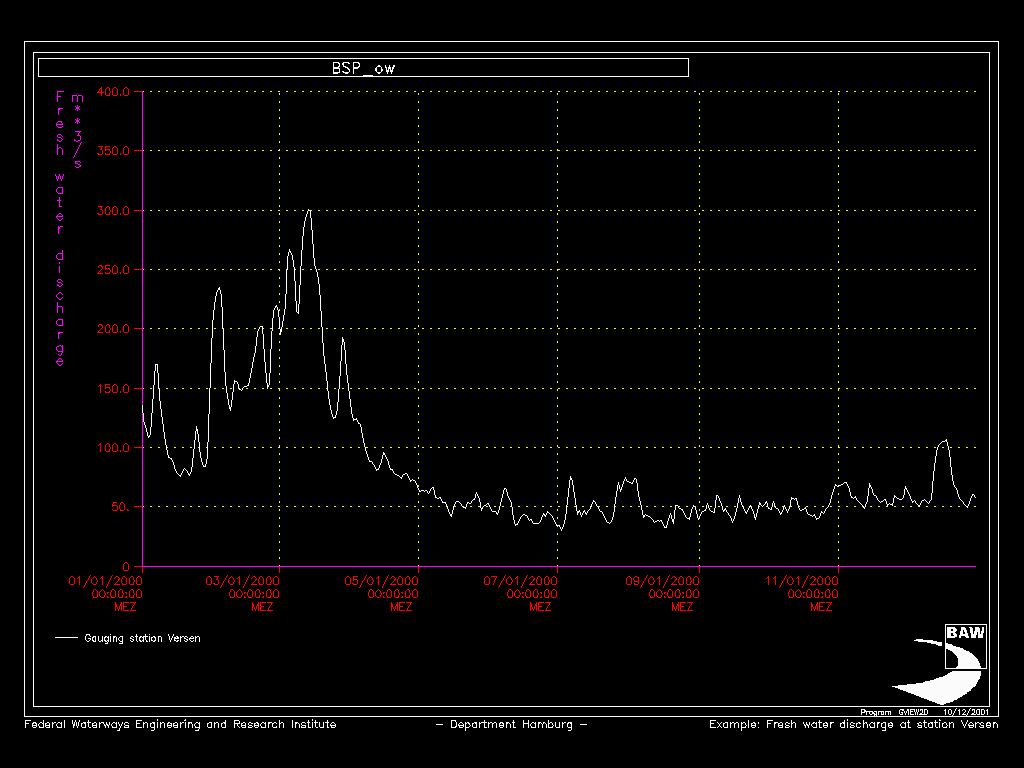
Example: Visualize measured data
Visualization of the measured fresh water discharge at gauging station Versen (river Ems) for the year 2000.

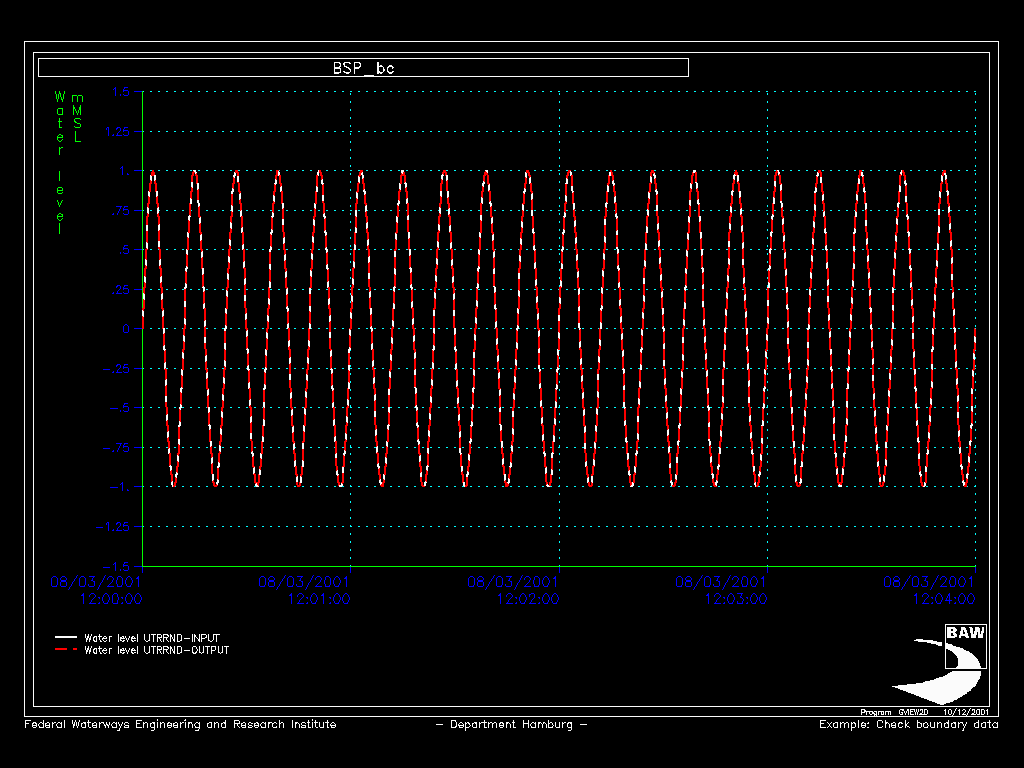
Example: Check boundary data
Comparison of the input and output time series of the program UTRRND. In this case it is a water level comparison at a harbour inlet.

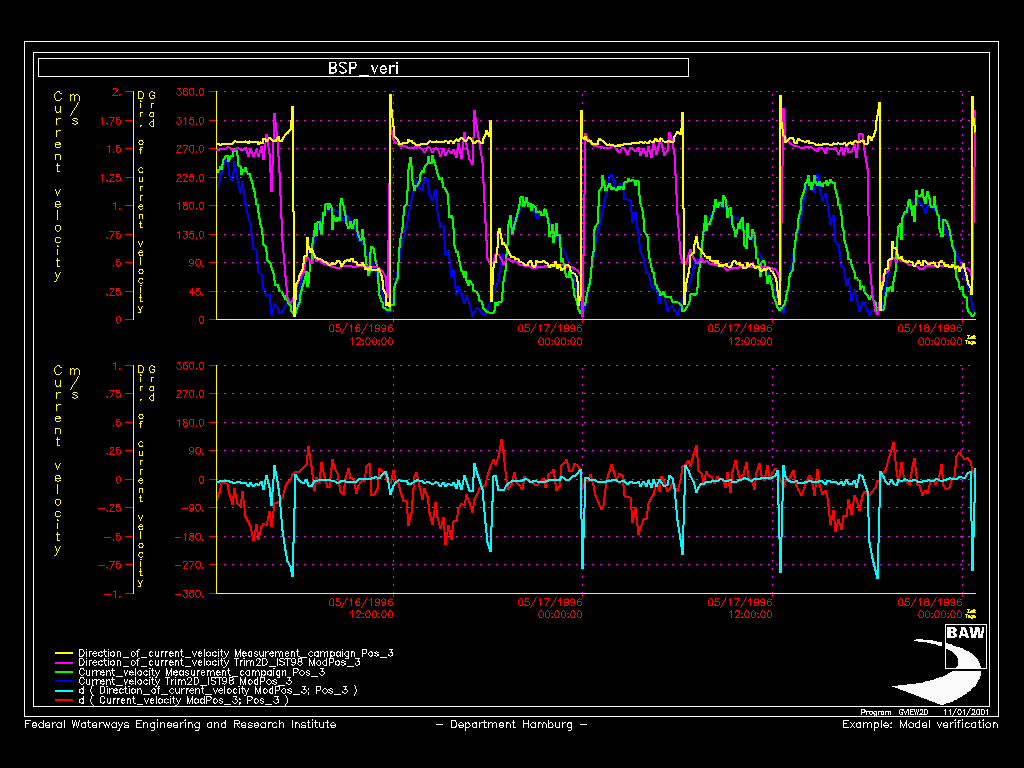
Example: Verify model data
Verification of Trim-2D model data in comparison with measured data. In this case it is a current velocity comparison (absolute value and direction) between measured data at a single position in the water column and at the equivalent model node (depth integrated model data!).

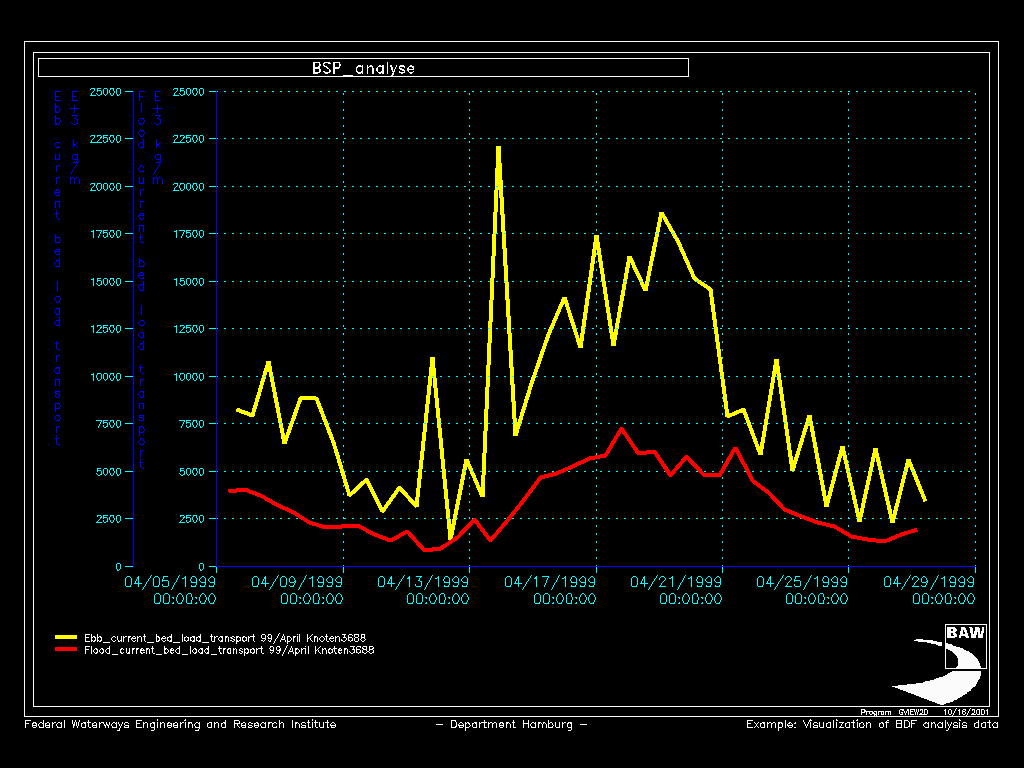
Example: Visualize postprocessed analysis data
Visualization of analysis data, computed by the hydrodynamic model TELEMAC-2D and postprocessed with the program Tdklf. You can see the flood and ebb current bed load transport for a selected data node of the north sea model near the mouth of the estuary Elbe.

back to GVIEW2D
